The Old Good “Ratchet Effect” in US Government Spending
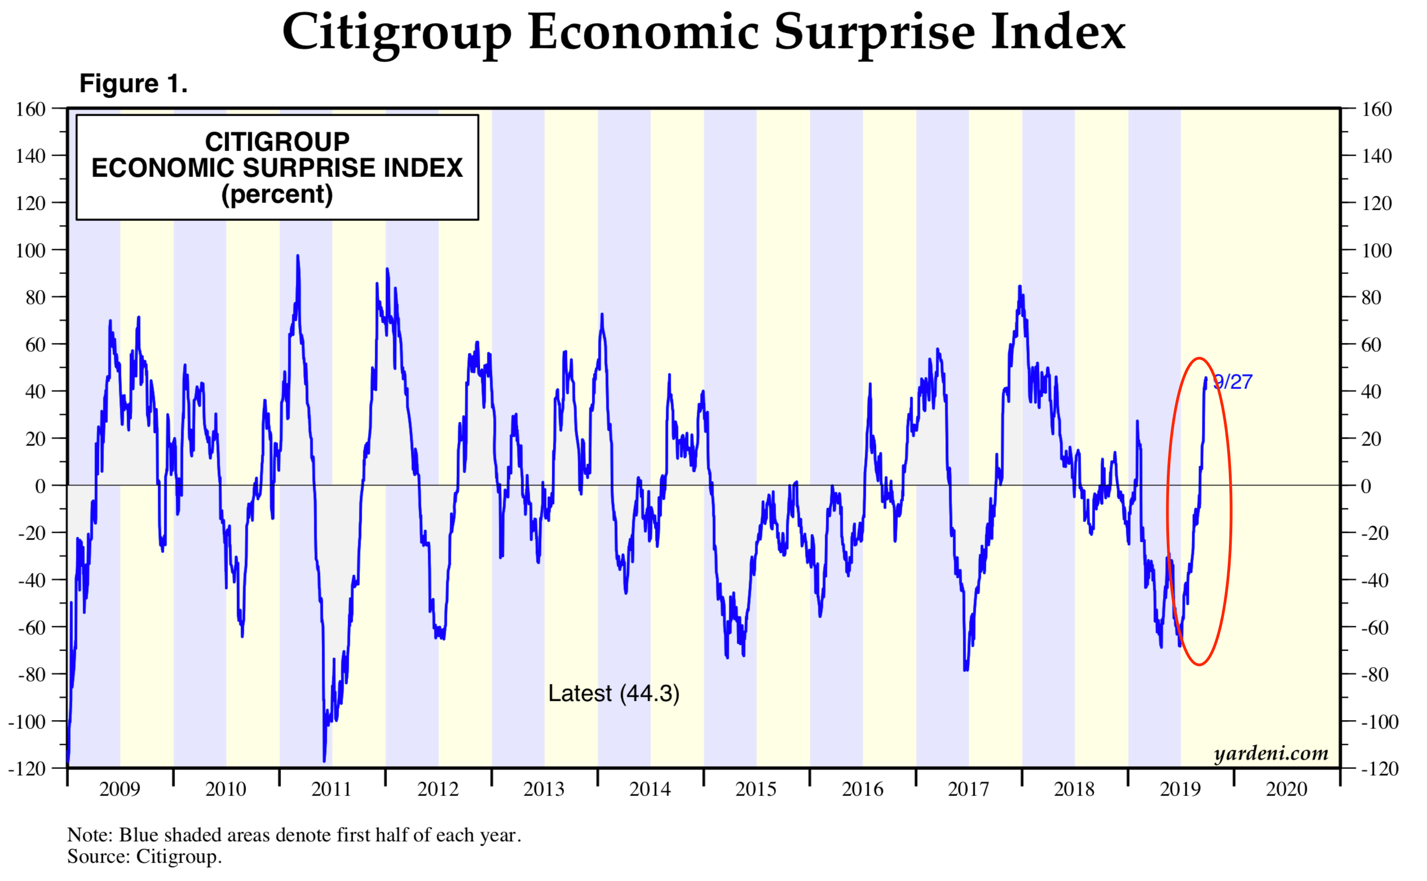
Some of you might notice that there was a major rebound on the US economic front in late Q3, which is best reflected in the index of economic surprises calculated by Citi:
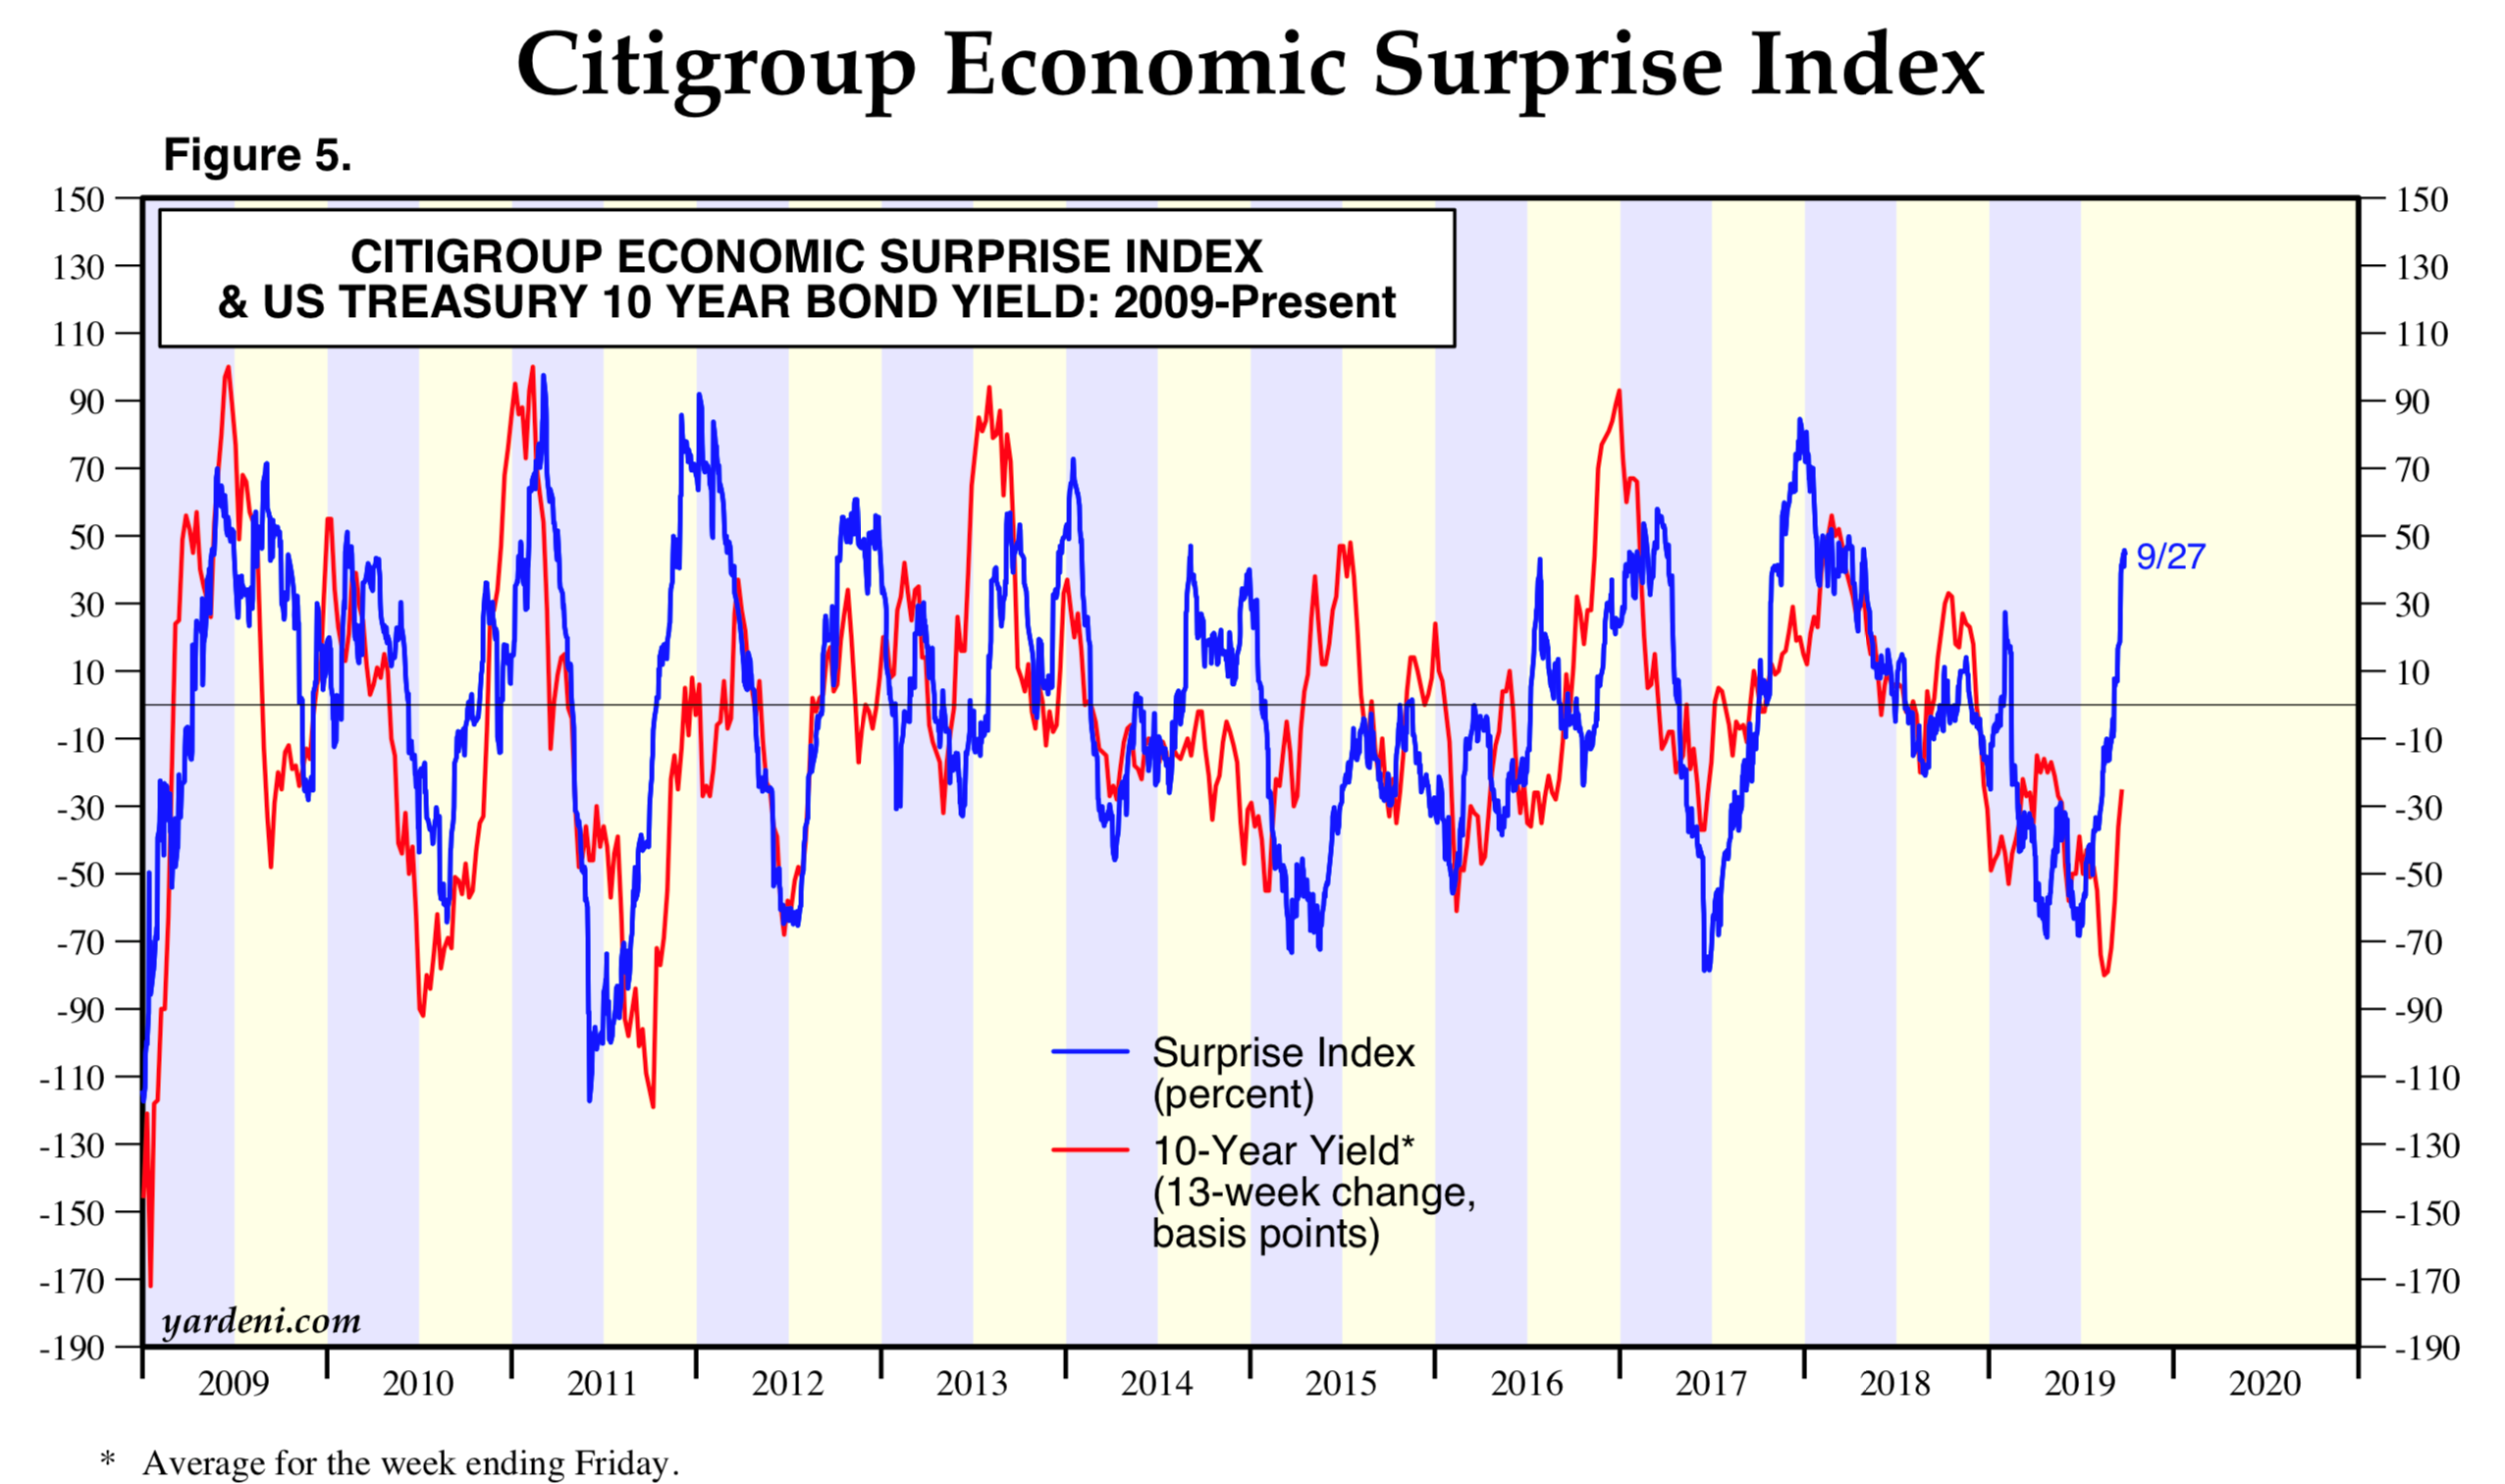
As a practical matter, this index is useful because it closely correlates with the demand for risk-free assets, like government bonds. You can see this if you put the yield on 10-year US Treasury note and the economic surprise index in one chart:
This transitory pickup could be the major downside driver for Gold, which is also a safe haven asset. The price failed to defend the bullish foothold at $1,500 mark on Monday despite numerous recent claims like “buy gold at any price”. Note that we are discussing only short-term behavior that largely ignores late-cycle concerns what is definitely bullish for Gold. Accelerating Core PCE in August to 1.8% YoY effectively curbs the expectation for extension of “pre-emptive” Fed stance for the remaining part of this year. This paves the way slower decline in real yield — the opportunity cost of holding of gold.
If US economic momentum is currently the primary argument in the function of demand for safe heavens, its subsequent decline should soon reverse the move in Gold and US bonds. It is impossible to establish the duration and amplitude of this momentum, but we can come at this from the other angle and establish the presence of seasonal factors that could extend economic pickup.
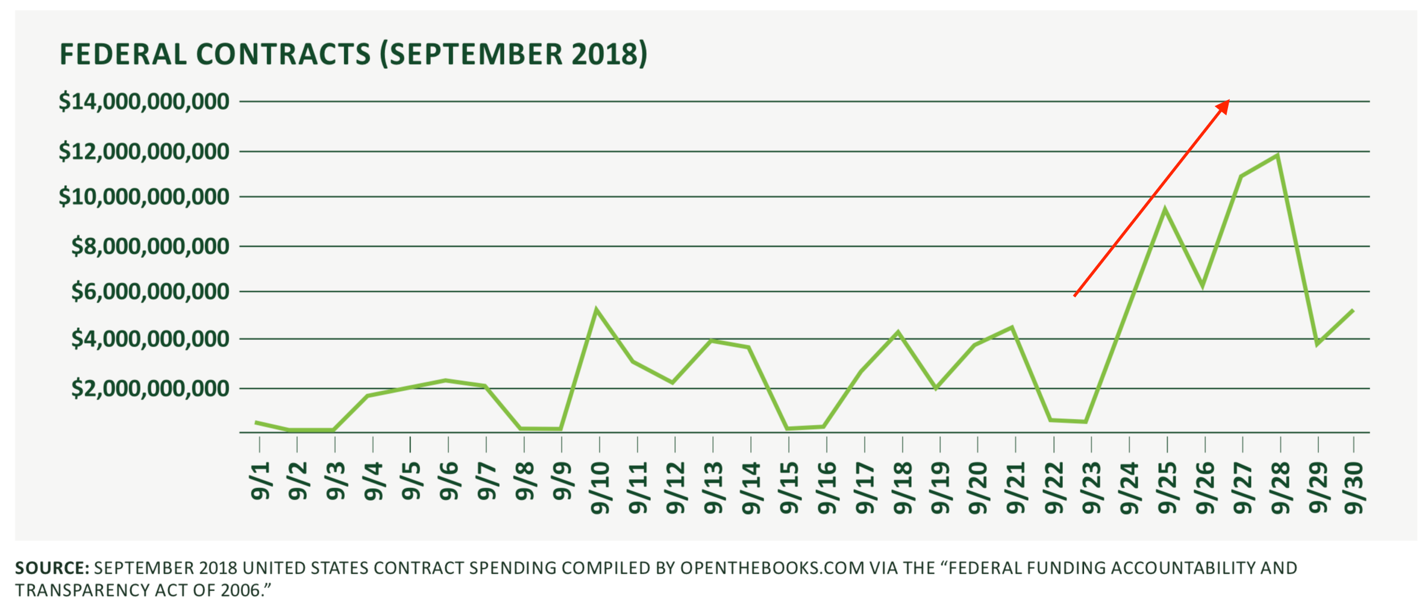
One such factor may be the well-known “ratchet effect” in the execution of the budget of US federal agencies. In order to avoid budget cuts in the next fiscal year, it is necessary to show that "there is always not enough money," that is, to spend the budget in full. The acceleration of expenditures usually occurs by the end of the fiscal year, when it is urgent to spend the "unplanned" surplus.
Here are some interesting facts about budget execution in 2018 fiscal year in the US:
- In the last fiscal week, federal agencies signed about 10% of all contracts;
- From 2015 to 2018, expenditures in September increased on average by 39%.
- In 2018, federal agencies spent $97 billion in September, and $53.3 billion over the last week of September, which is more than spending for the whole of August ($47 billion).
It is interesting whether US statistical agencies like BLS take this aberration into account when calculating economic indicators?
Please note that this material is provided for informational purposes only and should not be considered as investment advice.
Disclaimer: The material provided is for information purposes only and should not be considered as investment advice. The views, information, or opinions expressed in the text belong solely to the author, and not to the author’s employer, organization, committee or other group or individual or company.
Past performance is not indicative of future results.
High Risk Warning: CFDs are complex instruments and come with a high risk of losing money rapidly due to leverage. 69% and 73% of retail investor accounts lose money when trading CFDs with Tickmill UK Ltd and Tickmill Europe Ltd respectively. You should consider whether you understand how CFDs work and whether you can afford to take the high risk of losing your money.
Futures and Options: Trading futures and options on margin carries a high degree of risk and may result in losses exceeding your initial investment. These products are not suitable for all investors. Ensure you fully understand the risks and take appropriate care to manage your risk.