SP500 LDN TRADING UPDATE 17/12/25

SP500 LDN TRADING UPDATE 17/12/25
PLEASE NOTE THIS IS FINAL SP500 UPDATE OF 2025, UPDATES WILL RESUME JAN 6
WEEKLY & DAILY LEVELS
***QUOTING ES1! FOR CASH US500 EQUIVALENT LEVELS, SUBTRACT POINT DIFFERENCE***
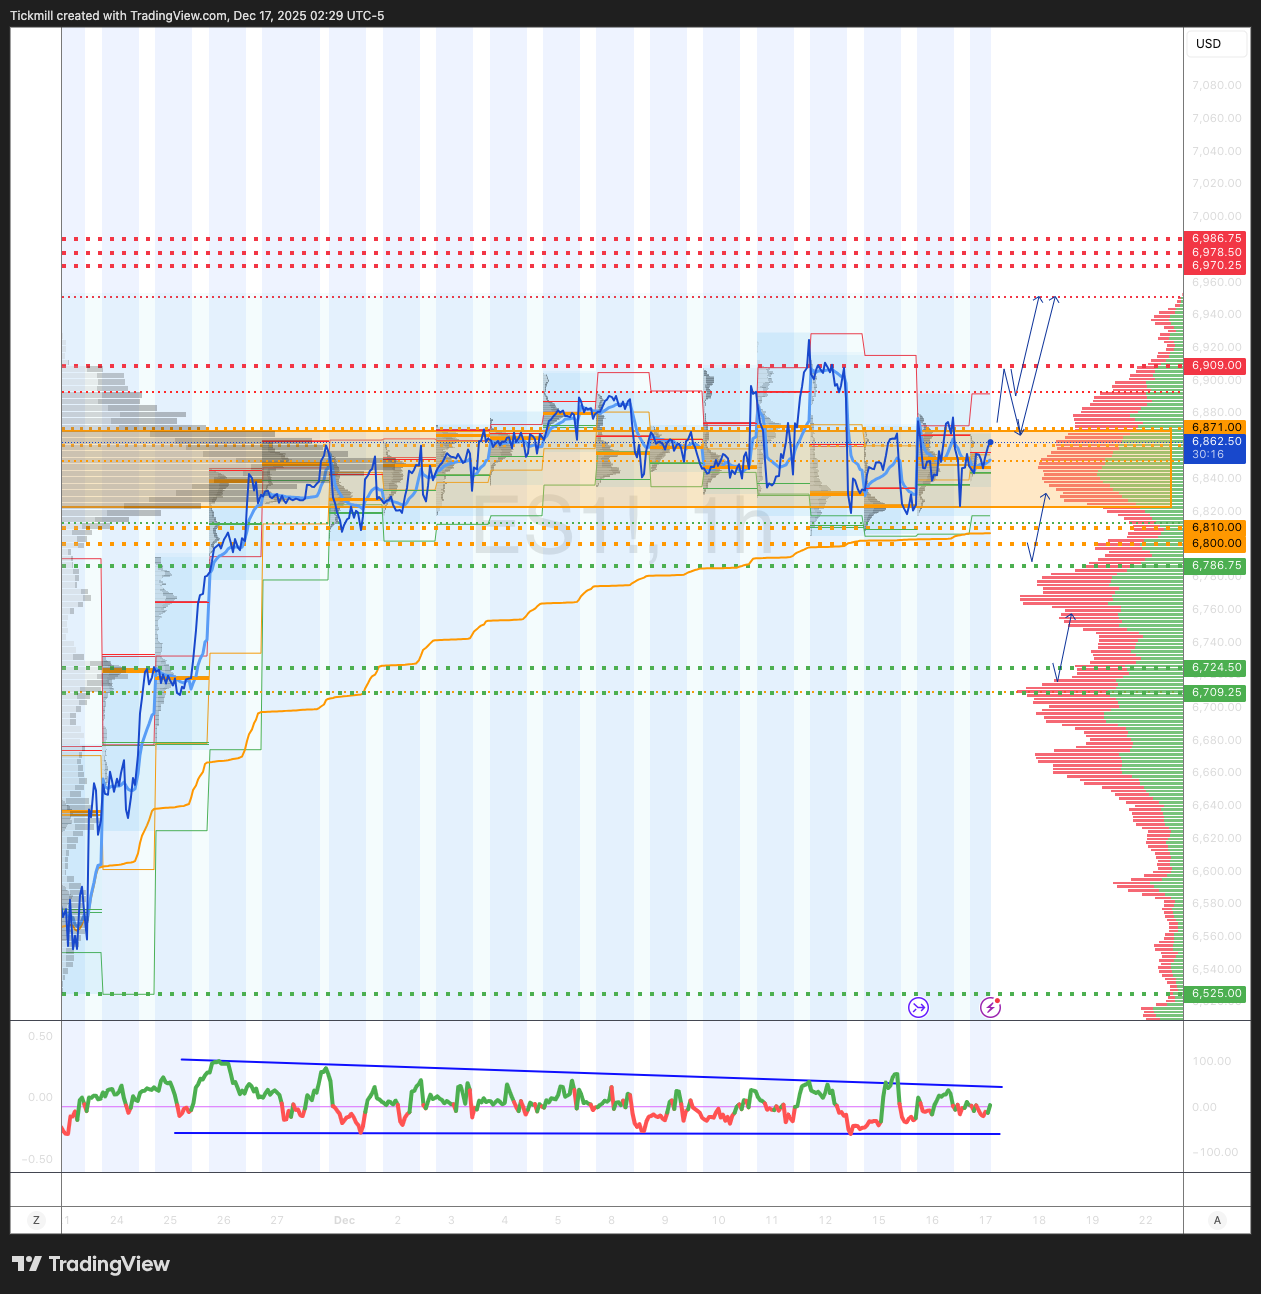
WEEKLY BULL BEAR ZONE 6810/00
WEEKLY RANGE RES 6940 SUP 6725
DEC EOM STRADDLE 6631/7067
DEC QOPEX STRADDLE 6303/7025
WEEKLY VWAP BULLISH 6766
MONTHLY VWAP BULLISH 6764
WEEKLY STRUCTURE – BALANCE - 6805/6909
MONTHLY STRUCTURE – BALANCE - 6952/6539
The week opens in a negative gamma regime with zero gamma ES ~6820). Below this, price is more sensitive and prone to sharper moves
DAILY STRUCTURE – BALANCE - 6805/6931
DAILY VWAP BULLISH 6852
DAILY BULL BEAR ZONE 6861/71
DAILY RANGE RES 6909 SUP 6786
2 SIGMA RES 6970 SUP 6724
VIX BULL BEAR ZONE 18.36
PUT/CALL RATIO 1.21
TRADES & TARGETS
SHORT ON TEST/REJECT DAILY BULL BEAR ZONE TRAGET WEEKLY BULL BEAR ZONE
LONG ON ACCEPTANCE ABOVE DAILY BULL BEAR ZONE TARGET DAILY RANGE RES
(I FADE TESTS OF 2 SIGMA LEVELS ESPECIALLY INTO THE FINAL HOUR OF THE NY CASH SESSION AS 90% OF THE TIME WHEN TESTED THE MARKET WILL CLOSE ABOVE OR BELOW THESE LEVELS)
GOLDMAN SACHS TRADING DESK VIEW
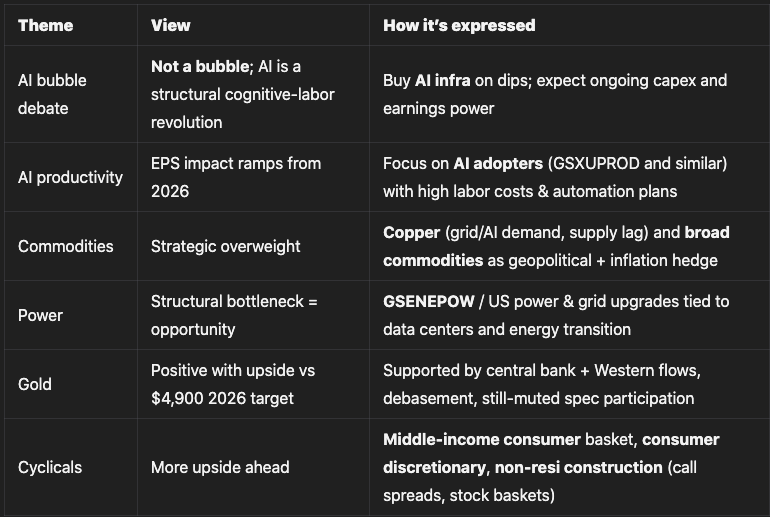
Big Picture: 2025–2026 Equity Themes
The author’s core message: this is not an AI bubble, and the AI-driven regime has deep macro, sector, and portfolio implications into 2026. The note highlights five main themes:
1. AI infrastructure dip-buying: Stay constructive on the AI capex / infra layer.
2. AI productivity winners: 2026 is when markets start rewarding adopters, not just suppliers.
3. Strategic case for commodities: Copper and gold as direct beneficiaries of AI/geopolitics and as portfolio insurance.
4. Power as a structural theme: US power constraints as a bottleneck to AI – and an equity opportunity.
5. Cyclical acceleration: Middle-income consumer and non-residential construction as under-owned, mispriced cyclical upside into 2026.
AI Bubble Debate & Investor Concerns
### 1. Is AI a Bubble?
View: No – the current AI cycle is fundamentally different.
Key arguments:
- First at-scale substitute for cognitive labor
Past tech (printing press, electricity, computers, internet) augmented humans or automated narrow tasks.
Frontier AI:
- Does general reasoning across domains without task-specific programming.
- Can improve itself (learning, emerging recursive self-improvement).
- Increasingly removes the human in the loop for coding, analysis, creative work, etc.
- Economic implication:
Capital can now directly substitute for cognitive labor at nearly zero marginal cost and global scalability. Companies can scale output without proportionally scaling headcount.
Positioning: buyer of the AI infrastructure layer on pullbacks
### 2. Top Investor Concerns on AI – and Responses
#### a) Useful life of chips
Concern: Are hyperscalers overstating earnings by extending chip depreciation lives?
- Anecdote from a big tech cloud resource leader:
- Still using NVIDIA A100s from 2020.
- GPU utilization ≈ 100%; no spare capacity.
- Older, less efficient racks still in use until new capacity lands.
Conclusion: This looks like genuine useful life, not aggressive accounting. Demand is so strong that older GPUs remain fully utilized.
#### b) AI adoption and EPS – are the gains real?
Concern: We haven’t seen much hard evidence of EPS uplift yet.
- Case study: large e-commerce retailer’s fraud/compliance ML system:
- Pre-AI: ~500 models, 24 months to build/deploy.
- With AI: 1 platform / 1 model in 3 months.
- Precision improved from 60% → 90%.
- Result: faster removal of fraudulent listings, faster seller onboarding, more compliant products → directly additive to top & bottom line.
GS framework:
For the first time, strategists assume:
- Only 5% of full AI productivity potential flows to earnings in 2026.
- 15% flows to earnings in 2027.
Interpretation: The monetization is just starting; EPS contribution ramps from 2026 onward.
#### c) Are AI valuations “blue sky”?
Concern: Has the market already fully priced AI upside?
- Since ChatGPT (Nov 2022):
- S&P 500 value up ≈ $24T.
- Broad AI beneficiary list accounts for ≈ $18T of that (mostly semis + hyperscalers).
- Add ≈ $1T from the top 3 private model companies → ≈ $19T, near the upper bound of GS’s macro AI benefit estimate.
- GS economists’ macro view:
- Present value of incremental AI capital income:
- Baseline: ~$8T
- **Range:** $5–19T
Even at the high macro estimate, AI still looks underpriced.
- Assume $19T incremental revenues (note: the text mixes revenue/income language; the author treats it as rev for the math):
- Profit margin: 20% → $3.8T–4T profits.
- Apply 22x P/E → ≈ $88T of potential equity value.
- Current S&P increase since ChatGPT: ≈ $24T.
→ Still large theoretical upside.
- Alternatively, apply 3–5x sales to $19T:
- $57–95T potential upside.
- On $8T base case:
- Value upside ≈ $25–40T.
Takeaway:
Valuations have moved a lot but are not obviously extreme relative to plausible AI economics, with additional optionality from margins and multiple expansion.
#### d) Credit risk from hyperscaler AI capex
Concern: Will hyperscaler balance sheets constrain AI capex?
View: Concerns are overblown.
- Since 2021, hyperscalers (AMZN, GOOGL, META, MSFT, ORCL):
- Increased net debt by $295B, but:
- Net debt / EBITDA ≈ 0.2x (very low).
- GS estimate: They could add ≈ $700B more net debt and still be <1x net leverage.
Constraint hierarchy:
- Likely constraints: supply bottlenecks and investor appetite, not cash flow or balance sheet capacity.
AI Productivity: Beyond Infra – Playing the Adoption Theme
The note stresses that AI beneficiaries aren’t only chipmakers and hyperscalers.
### GS US AI Productivity Basket (GSXUPROD)
- Basket of non-Tech, non-AI companies that:
- Have high labor costs,
- High exposure to AI automation,
- Concrete plans to deploy AI to cut costs and lift margins.
- Performance:
- YTD underperformed S&P 500, and only recently crossed the S&P ex-top-10 basket (SPXX).
Implication:
This is a late-cycle AI trade – adoption-side beneficiaries still appear under-owned vs infra winners.
Commodities & Power: AI, Geopolitics, and Portfolio Insurance
### 1. Strategic Case for Commodities
Context: AI race + concentrated commodity supply = structural support.
- The US:
- 44% of global data center capacity vs 26% for China.
- Leads in advanced chips.
- China:
- Holds a strong edge in critical commodities and power needed for tech/AI.
Four key implications:
1. Rare earth and critical minerals leverage
- China’s tight grip makes it harder for others to impose harsh trade barriers.
- Likely allows China to maintain some access to advanced chips.
- Supports ongoing China export strength and current account surplus.
2. US power-market risk
- US power prices risk moving significantly higher, with outage risks.
- Risk is concentrated: 72% of US datacenters sit in just 1% of US counties.
- Power bottlenecks could slow US AI progress vs China.
3. Copper bull case
- AI, grid upgrades, geopolitics, hybrid warfare → urgent grid and power investments.
- Strong demand, lagging mine supply.
- GS expects copper to rally to ~$15,000 by 2035 to balance the market.
4. Concentrated commodity supply as risk
- More supply is in geopolitical or trade hotspots.
- Raises supply disruption risk.
- Enhances “insurance value” of commodities in portfolios.
Historical pattern:
In 12‑month periods when both stocks and bonds had negative real returns, either commodities or gold historically delivered positive real returns.
Power as an Investable Theme
- GS Power Up America Index (GSENEPOW) has been flat over the last 3 months.
- Yet:
- US power markets face under-capacity vs demand + coal retirements.
- Data center clusters amplify local shortages and price spikes.
- View: This is a high‑conviction long-term theme tied directly to AI deployment and energy transition.
Gold: Debasement, Diversification, and Positioning
Base case: GS has an end-2026 gold price target of ~$4,900/oz, with significant upside risk.
Key drivers:
- 2024 dynamics:
- Central banks kept buying large amounts of gold.
- Western investors stopped selling as Fed cuts became more likely.
- Removal of “relief valve” (investor selling) + official sector demand → ~30% gold price rise in 2024.
- 2025 shift:
- Now we see both central banks and Western investors buying, competing for limited bullion.
- Debasement theme: relative to US equities & privately-held Treasuries, the gold market is small → even modest diversification flows can move prices.
- Positioning:
- Specs not fully back in:
- Chinese positioning ~30% below highs.
- GS CTA net length ~35% lower.
- CFTC net spec at mid-2025 levels.
- ETFs: elevated but sticky, little liquidation during the Oct selloff.
- No meaningful “CIO-style” big allocation yet.
Rule of thumb:
Each 1bp increase in gold’s share of US financial portfolios → ~1.4% increase in gold price
Cyclical Acceleration into 2026
The note argues that cyclicals have started to outperform and have further room to run, especially:
1. Middle-income consumer stocks
2. Non-residential construction plays
### 1. Middle-Income Consumer
- Cyclicals have:
- Rallied sharply and outperformed defensives for 14 consecutive days (record).
- Yet:
- Some cyclical segments, especially middle-income consumer, still screen cheap vs macro pricing.
Macro backdrop for 2026:
- GS economists forecast real income growth >2.5% in 2026 for the 3rd and 4th income quintiles, driven by:
- Fading tariff‑driven inflation.
- Tax cuts from the “One Big Beautiful Bill” moving into refunds.
- Stabilizing labor markets.
Valuation & positioning:
- Median middle-income consumer stock:
- Trades at 15x forward EPS.
- 35th percentile vs last 10 years.
- >20% discount vs median S&P 500 stock (**19x**).
- Positioning (GS Prime Brokerage):
- Consumer discretionary gross exposure = lowest on record.
- Net exposure in the 1st percentile over the last year → extremely under-owned.
Implementation mentioned:
- Call spreads on GSXUMIDC, XLY, AMZN screen as attractive ways to play the theme (details/pricing referenced as available on request).
### 2. Non-Residential Construction
- 2026 environment expected to improve, with:
- Easier financial conditions.
- Policy tailwinds from the One Big Beautiful Bill Act.
- Forward indicators (Dodge Momentum Index, Fed surveys) signaling better construction outlook.
- GS screens 29 stocks with non-resi construction exposure:
- Concentrated in Ground Transportation and Building Products.
Conclusion on cyclicals:
Cyclicals (especially consumer and non-resi construction) are:
- Under-owned,
- Inexpensive vs history and vs macro backdrop,
- Positioned for improving fundamentals in 2026.
Key Takeaways for an Investor
The overarching stance: We’re in a durable AI-led capital and productivity cycle, not a fleeting hype phase, with knock-on effects spanning tech, power, commodities, and cyclicals into and through 2026.
Disclaimer: The material provided is for information purposes only and should not be considered as investment advice. The views, information, or opinions expressed in the text belong solely to the author, and not to the author’s employer, organization, committee or other group or individual or company.
Past performance is not indicative of future results.
High Risk Warning: CFDs are complex instruments and come with a high risk of losing money rapidly due to leverage. 71% and 74% of retail investor accounts lose money when trading CFDs with Tickmill UK Ltd and Tickmill Europe Ltd respectively. You should consider whether you understand how CFDs work and whether you can afford to take the high risk of losing your money.
Futures and Options: Trading futures and options on margin carries a high degree of risk and may result in losses exceeding your initial investment. These products are not suitable for all investors. Ensure you fully understand the risks and take appropriate care to manage your risk.
Patrick has been involved in the financial markets for well over a decade as a self-educated professional trader and money manager. Flitting between the roles of market commentator, analyst and mentor, Patrick has improved the technical skills and psychological stance of literally hundreds of traders – coaching them to become savvy market operators!