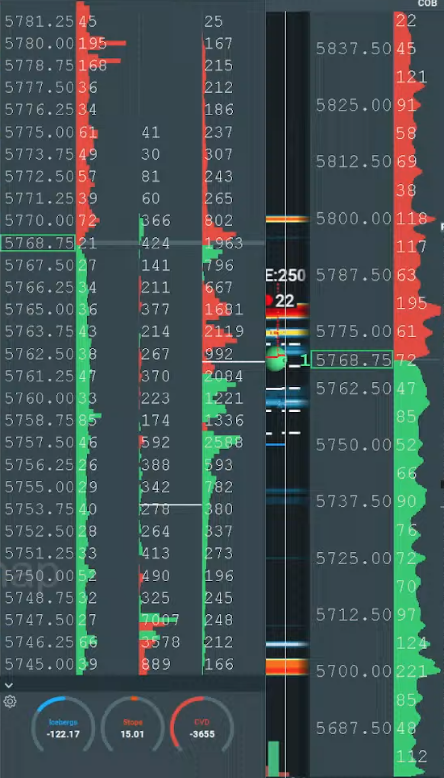
SP500 LDN TRADING UPDATE 7/03/25
WEEKLY BULL BEAR ZONE 6025/35
WEEKLY RANGE RES 6080 SUP 5836
DAILY BULL BEAR ZONE 5740/30
DAILY RANGE RES 5719 SUP 5803
EQUALITY TARGET AGAINST 6000 SWING HIGH 5680
5680 MONTHLY PROJECTED RANGE SUPPORT
WEEKLY ACTION AREA VIDEO
TODAY'S TRADE LEVELS & TARGETS
SHORT ON TEST/REJECT DAILY RANGE RES TARGET DAILY BULL BEAR ZONE
LONG ON TEST/REJECT OF DAILY BULL BEAR ZONE TARGET DAILY RANGE RES
LONG ON ACCEPTANCE ABOVE 5820 TARGET 5850
GOLDMAN SACHS TRADING DESK VIEWS
.U.S. EQUITIES SUMMARY: RISK-OFF SENTIMENT
FICC and Equities 6 March 2025 |
Market Overview:
- S&P 500: +178 bps, closing at 5738 with a MOC of $2069.
- Dow Jones: -99 bps, ending at 42,579.
- Volume: 15.9 billion shares traded across all U.S. equity exchanges, above the YTD daily average of 15.3 billion shares.
- Volatility Index (VIX): +1400 bps, now at 25.
- Crude Oil: -5 bps, settling at $66.29.
- U.S. 10-Year Yield: +2 bps, now at 4.29%.
- Gold: -29 bps, closing at $2910.
- DXY (Dollar Index): -10 bps, now at 104.17.
- Bitcoin: -114 bps, trading at $89,339.
Key Drivers of Market Decline:
1. Tariff Fatigue: Ongoing concerns about the economic impact of tariffs.
2. AI Trade Sustainability: Reports suggest Alibaba’s new DeepSeek rival operates with only 5% of the data units required by DeepSeek’s low-cost model, raising competitive pressures.
3. Disappointing Tech Earnings: Key players like Marvell Technology (MRVL) and MongoDB (MDB) saw significant declines, both trading down over 20% post-earnings.
4. Upward Pressure on Sovereign Rates: Higher rates continue to weigh on equity valuations.
Sector Performance:
- High-beta momentum stocks, which were 12-month leaders, fell sharply, down 6.7% today and 8% YTD.
- Liquidity remains a challenge, with 3-month screens hitting new lows.
Market Sentiment and Activity:
- The tomorrow straddle is pricing in 165 bps, indicating elevated uncertainty.
- Economic data estimates:
- Nonfarm Payroll: +170k (vs consensus +160k).
- Average Hourly Earnings (MoM): +0.3% (in line with consensus).
- Unemployment Rate: 4% (in line with consensus).
- Whispers suggest a weaker payroll number around ~120k.
Trading Desk Insights:
- Activity levels rated a 6 out of 10.
- Net sellers dominated:
- Floor traders: -4% net sellers vs +30 bps 30-day average.
- Long-Only (LO) funds: -$1.2 billion net sellers, driven by Tech, Financials, and Industrials.
- Hedge Funds (HFs): Slight net buyers, with demand in Financials and REITs offset by supply in Discretionary.
- Feedback suggests rallies should be sold until the market can sustain a bid, with limited appetite for weekend risk.
CTA Flows:
- CTAs have sold $47 billion globally in the past week.
- Projections:
- 1-week flat tape = $40 billion to sell.
- 1-month flat tape = $43 billion to sell.
- The similar sell expectations over one week and one month suggest this technical supply may largely conclude by next week.
Signs of Capitulation?
- Short Answer: No.
- Little evidence of price-agnostic, aggressive risk-reduction flows on the High-Touch desk.
- Continued Long-Only reductions in Semiconductor names and infrastructure, reflecting a clear trend of selling by large clients.
- Weakness in popular TMT longs (APP, SPOT, DASH, META, AMZN) suggests some Hedge Fund gross-down activity, despite no significant micro news in the sector.
Conclusion:
The market remains under pressure, with liquidity challenges, disappointing earnings, and macro headwinds driving risk-off sentiment. Until the market stabilizes with sustained bids, rallies are likely to face selling pressure.
Potential Stabilizing Factors: AVGO Earnings as a Key Pivot Point. Broadcom (AVGO) has the potential to serve as a major pivot for price action and market sentiment. The stock surged +7% in after-hours trading, driven by a solid revenue beat for the quarter ($14.92B vs. consensus $14.61B), with upside attributed to AI semiconductor solutions. AVGO also provided strong guidance for Q2 revenues. However, the key question remains: can the stock sustain these gains, given the recurring "beat-and-fade" patterns observed among Semi/AI peers?
Technical Landscape: Mixed Signals
The technical backdrop appears mixed. While the S&P 500 (SPX) broke below its 200-day moving average intraday, this is counterbalanced by many major indices and key single-stock bellwethers nearing technically "oversold" levels. For example, the Nasdaq 100 (NDX) RSI is at 32, Amazon (AMZN) RSI is at 30, and Tesla (TSLA) RSI is at 26.
Derivatives Market Insights
The market continues to experience elevated daily straddle movements. Today, we ended down 1.78% versus the implied move of 1.05%. Skew declined as volatility was bid up again, particularly in the front months. On this downward move, we observed clients monetizing downside protection by selling puts to close positions. Additionally, clients were selling VIX call spreads, with the VIX now hovering near the 25 level. For those looking to hedge further downside risk, we recommend spreads over outright puts due to higher implied volatility levels. The straddle for tomorrow is priced at 1.60%, marking the highest level since August

Disclaimer: The material provided is for information purposes only and should not be considered as investment advice. The views, information, or opinions expressed in the text belong solely to the author, and not to the author’s employer, organization, committee or other group or individual or company.
Past performance is not indicative of future results.
High Risk Warning: CFDs are complex instruments and come with a high risk of losing money rapidly due to leverage. 73% and 72% of retail investor accounts lose money when trading CFDs with Tickmill UK Ltd and Tickmill Europe Ltd respectively. You should consider whether you understand how CFDs work and whether you can afford to take the high risk of losing your money.
Futures and Options: Trading futures and options on margin carries a high degree of risk and may result in losses exceeding your initial investment. These products are not suitable for all investors. Ensure you fully understand the risks and take appropriate care to manage your risk.
Patrick has been involved in the financial markets for well over a decade as a self-educated professional trader and money manager. Flitting between the roles of market commentator, analyst and mentor, Patrick has improved the technical skills and psychological stance of literally hundreds of traders – coaching them to become savvy market operators!
