S&P500 at a Crossroads: Potential Price Drop Ahead?

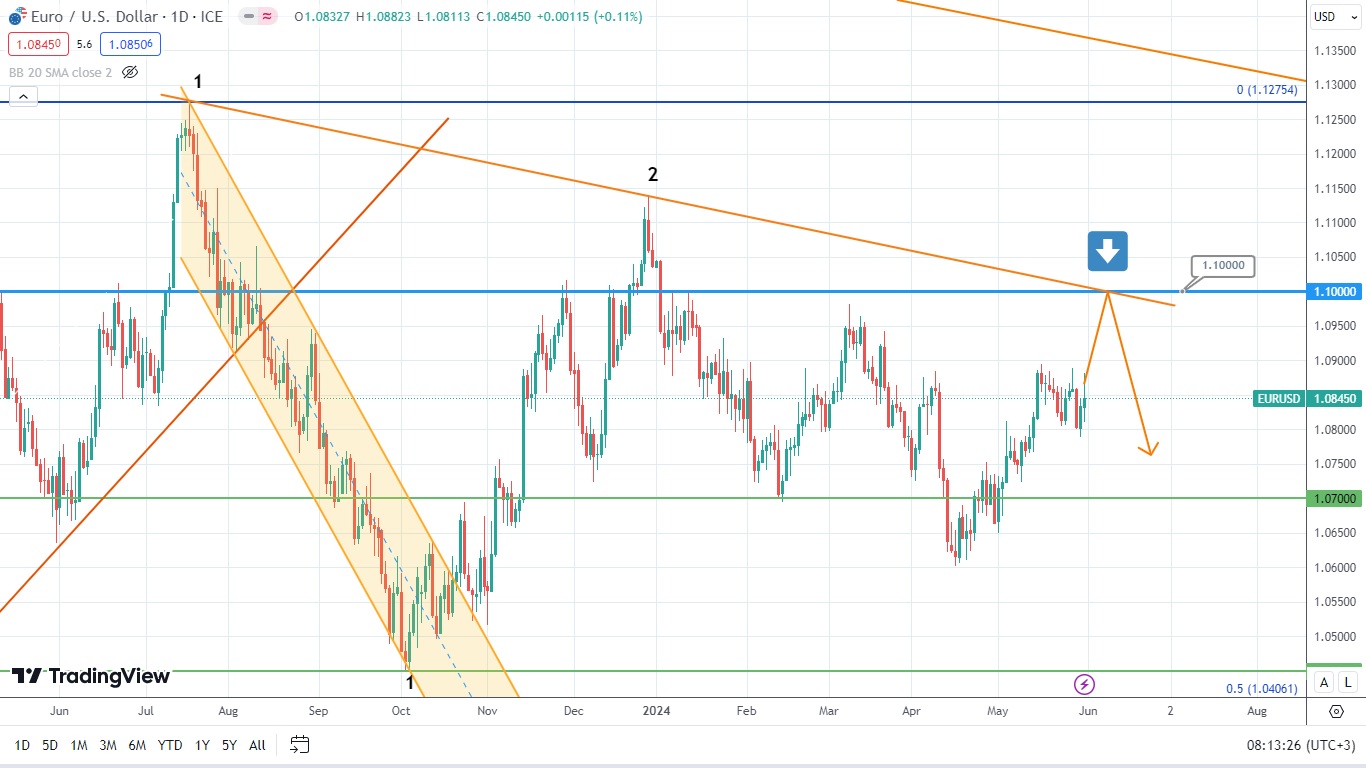
The price of the currency pair EUR/USD is gradually heading up, approaching the resistance level of 1.1000, and the downtrend formed between points 1 and 2. The price of this asset might rebound at the crossing point of these trendlines and drop. The chart below shows the newly formed range between levels 1.1000 and 1.0700.
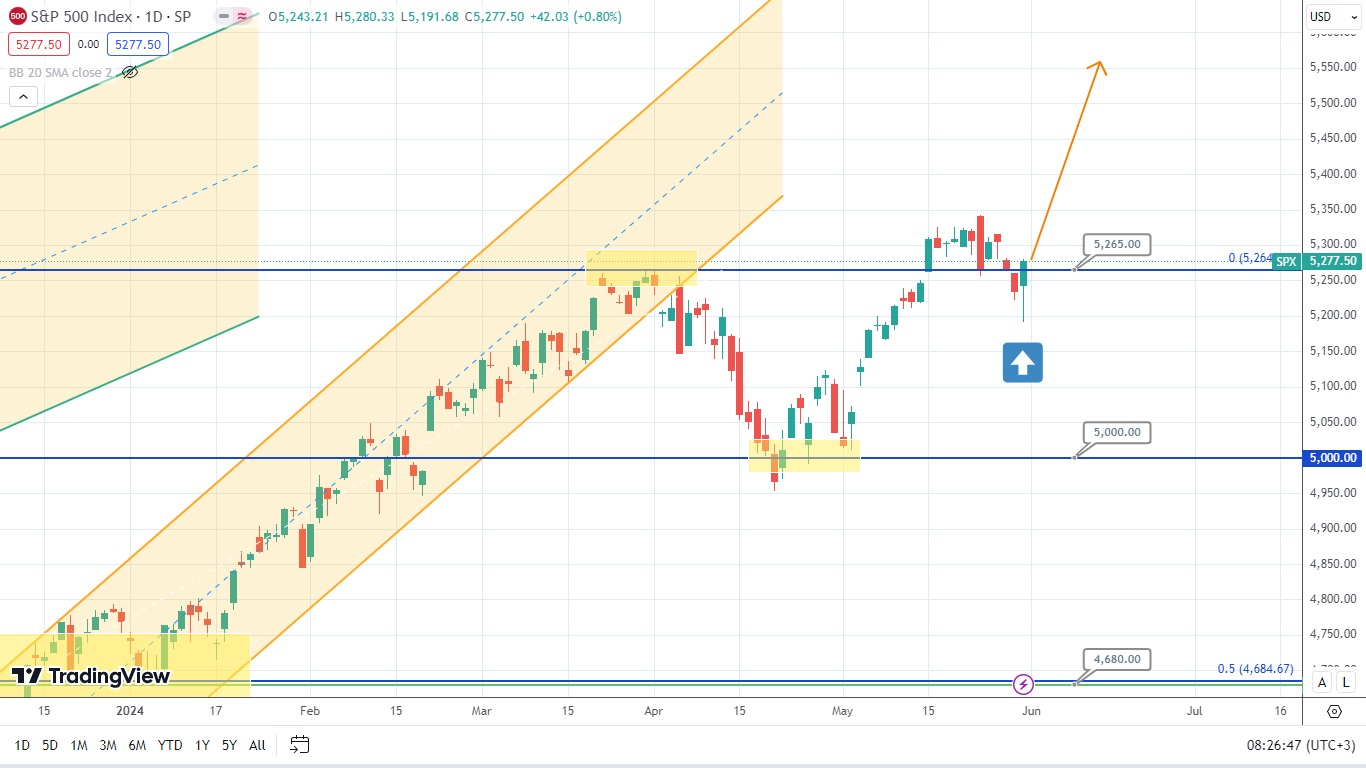
The price of the American stock index S&P500 broke the resistance level of 5265. It is now testing this level from another side, trying to find the pullback points. Last Thursday, the price of the index tried to dive under the resistance. However, the bulls seized the initiative and pushed the asset’s price under the level of 5265 at the end of the trading week. This has caused the formation of a bullish engulfing. Of course, bears might try to trigger the correction, yet the price of the index may still rise. So, let’s observe what might happen next.
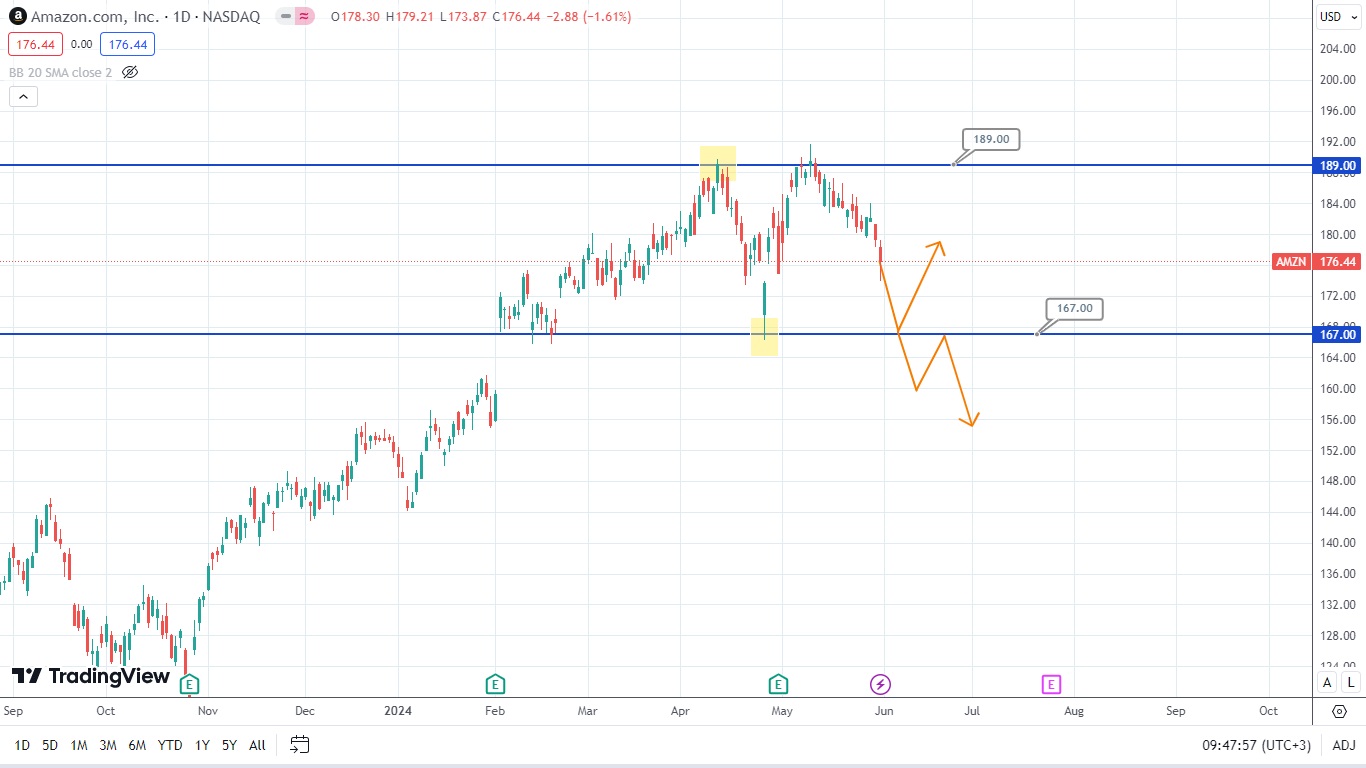
The price of Amazon stock is heading down. It is currently approaching the supporting level of 167.00. The asset’s price might gain the required support, jump, and reach the maximum point at the level of 189. On the other hand, it might also break this support through and form the double top. Hence, at this point, it would be wise to follow the candlestick formations to analyse possible price movements for this asset.
Disclaimer: The material provided is for information purposes only and should not be considered as investment advice. The views, information, or opinions expressed in the text belong solely to the author, and not to the author’s employer, organization, committee or other group or individual or company.
Past performance is not indicative of future results.
High Risk Warning: CFDs are complex instruments and come with a high risk of losing money rapidly due to leverage. 69% and 73% of retail investor accounts lose money when trading CFDs with Tickmill UK Ltd and Tickmill Europe Ltd respectively. You should consider whether you understand how CFDs work and whether you can afford to take the high risk of losing your money.
Futures and Options: Trading futures and options on margin carries a high degree of risk and may result in losses exceeding your initial investment. These products are not suitable for all investors. Ensure you fully understand the risks and take appropriate care to manage your risk.