Market Spotlight: GBPCHF Looking To Breakout

GBPCHF Testing Structure Top
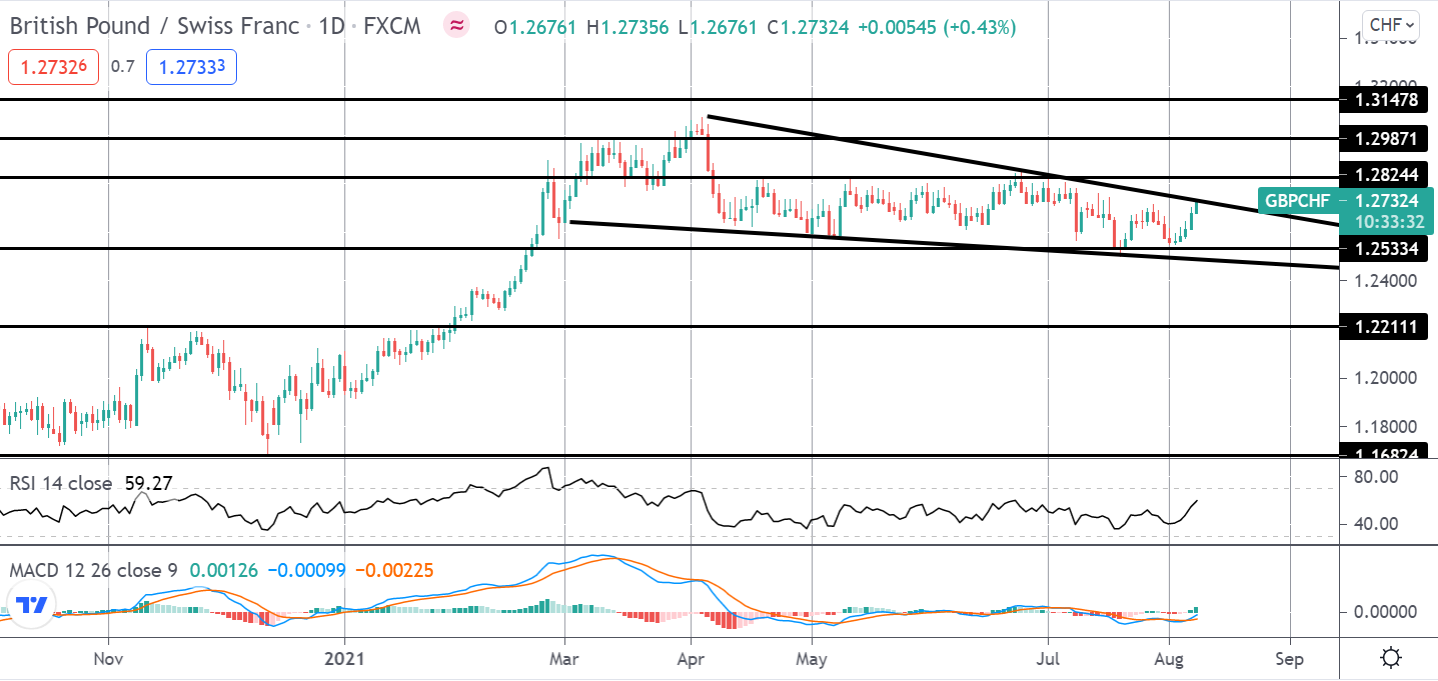
The price action in GBPCHF right now is showing some interesting developments that are worth monitoring. The correction in GBPCHF form YTD highs has been framed by a falling wedge pattern, suggesting there is still room for a break higher here. Price has recently found support into the 1.2533 level with plenty of bullish divergence in both RSI and MACD. With both indicators now turned bullish, price is testing the top of the falling wedge pattern. If the current rally prevails, bulls can look for a break of the 1.2824 highs, targeting 12987 initially and 1.3147 thereafter.
With the BOE setting out its path to modest tightening over the coming years and with the SNB reaffirming its commitment to maintaining an easing presence, the divergence in monetary policy outlooks between the two banks creates plenty of room for further upside in this pair.
Key Data to Watch
Little in the way of tier one data this week. However, in the UK there is a slew of data on Thursday which could cause some movement including preliminary quarterly GDP as well as industrial and manufacturing production. Aside from these prints, headlines around COVID and UK politics are likely to be the main driver along with risk flows which, while equities remain supported, should keep CHF pressured.
Disclaimer: The material provided is for information purposes only and should not be considered as investment advice. The views, information, or opinions expressed in the text belong solely to the author, and not to the author’s employer, organization, committee or other group or individual or company.
Past performance is not indicative of future results.
High Risk Warning: CFDs are complex instruments and come with a high risk of losing money rapidly due to leverage. 69% and 73% of retail investor accounts lose money when trading CFDs with Tickmill UK Ltd and Tickmill Europe Ltd respectively. You should consider whether you understand how CFDs work and whether you can afford to take the high risk of losing your money.
Futures and Options: Trading futures and options on margin carries a high degree of risk and may result in losses exceeding your initial investment. These products are not suitable for all investors. Ensure you fully understand the risks and take appropriate care to manage your risk.
With 10 years of experience as a private trader and professional market analyst under his belt, James has carved out an impressive industry reputation. Able to both dissect and explain the key fundamental developments in the market, he communicates their importance and relevance in a succinct and straight forward manner.