Institutional Insights: Nomura:-VOL CONTROL LARGEST PROJECTED 1M "BUY" IN MODEL HISTORY
.jpeg)
The persistent selling of volatility continues unabated, as previously perceived risks are being mitigated, desensitized, or outright dismissed. Meanwhile, exposures are being re-entered, with participants "buying the highs."
The desk observed similar "Vol Supply" flows yesterday in single-name equities, with at-the-money implied volatility (iVol) for several major names, such as NVDA and GOOGL, hovering at or near yearly lows. Notable trades from yesterday include (credit to A. Kosoglyadov for insights):
- AMZN: 30,000 July 235 Calls sold at $0.35
- COF: 5,400 July 220 Calls sold at $1.15
- MA: 5,500 July 610 Calls sold at $0.39
- MRVL: Nomura client sold 12,500 July 85 Calls at $0.73
- OXY: 5,000 July 42.5 Puts sold at $1.15
- TSLA: 7,200 July 450 Calls sold at $1.80
- SCHW: 22,500 July 100 Calls sold at $0.26
- WBD: 8,700 January 10 Calls sold at $2.10
Additionally, significant selling in medium-term skew for December was observed yesterday. Already this morning, there’s more activity pointing toward expectations of a summer volatility decline, with trades such as VIX August 1x2 Put Spreads being initiated.
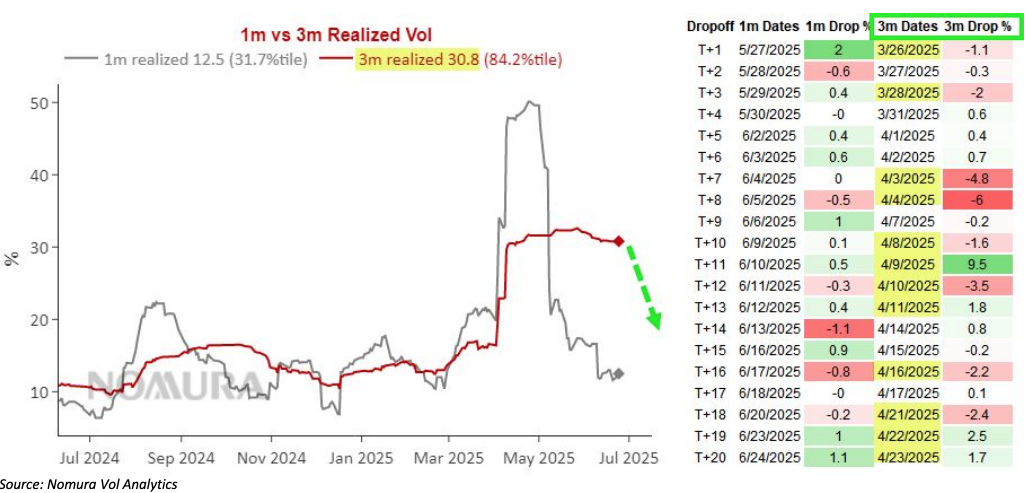
As highlighted in yesterday’s email, we anticipate notable Vol Control reallocation into equities over the next month. This is driven by the sharp decline in trailing 3-month realized volatility (rVol), which is currently averaging down significantly. The subdued market environment (SPX 20-day rVol at 10.3) is one contributing factor, but the upcoming removal of April's "Liberation Day" realized volatility shock days from sample windows is just as impactful. Many models, while smoothing out sudden drops, also place heavier weight on the most recent inputs, further amplifying this dynamic.
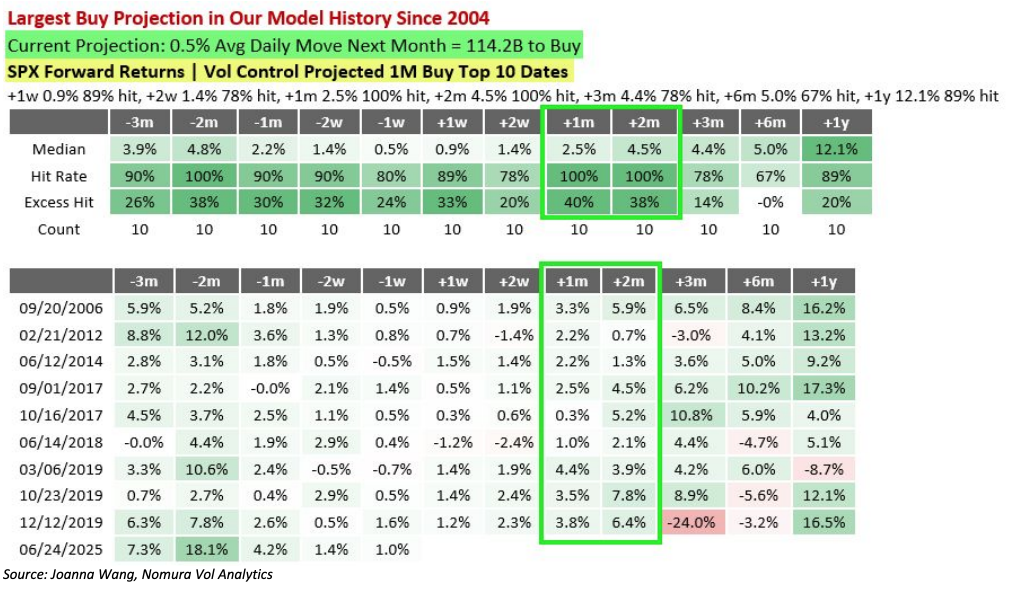
Through last night’s close, the latest projection for Volatility-Controlled (VC) buying, assuming an average 50bps SPX daily move over the next month, is estimated at +$114.2B to BUY. This marks the largest 1-month BUY projection in our model’s history dating back to 2004.
When analyzing forward SPX returns following the prior top 10 days of largest projected 1-month VC buying, particularly after a significant realized volatility reset lower, equities tend to move higher. This pattern exhibits high hit rates and substantial excess returns, specifically within the 1-month and 2-month forward windows, showing a 100% hit rate for “higher” outcomes, with 40% and 38% excess returns, respectively. These dynamics often create a self-reinforcing cycle, as market participants increase exposure, raise net positions, and boost beta, leading to positioning asymmetry. This “buying the highs” behavior can subsequently transform into de-risking flows, even with a marginal uptick in realized volatility.
However, significant potential risk events loom in the coming weeks, such as the reciprocal tariff deadline on July 8 and heightened “TACO” expectations. These systematic exposure and positioning pressures are especially strong when they happen alongside the sharp increases in market risk seen recently. This phenomenon amplifies downside accelerant flows, as options dealers hedge short put positions during selloffs by selling more futures as spot prices drop. This, in turn, can trigger systematic “volatility-scaler” deallocation selling as realized volatility rises.
In essence, the initial “higher” movement sets the stage for potential “lower” outcomes thereafter, driven by these interconnected market dynamics.
Disclaimer: The material provided is for information purposes only and should not be considered as investment advice. The views, information, or opinions expressed in the text belong solely to the author, and not to the author’s employer, organization, committee or other group or individual or company.
Past performance is not indicative of future results.
High Risk Warning: CFDs are complex instruments and come with a high risk of losing money rapidly due to leverage. 69% and 73% of retail investor accounts lose money when trading CFDs with Tickmill UK Ltd and Tickmill Europe Ltd respectively. You should consider whether you understand how CFDs work and whether you can afford to take the high risk of losing your money.
Futures and Options: Trading futures and options on margin carries a high degree of risk and may result in losses exceeding your initial investment. These products are not suitable for all investors. Ensure you fully understand the risks and take appropriate care to manage your risk.
Patrick has been involved in the financial markets for well over a decade as a self-educated professional trader and money manager. Flitting between the roles of market commentator, analyst and mentor, Patrick has improved the technical skills and psychological stance of literally hundreds of traders – coaching them to become savvy market operators!