Institutional Insights: Nomura Cross-Asset: DOG DAYS
Nomura Cross-Asset: DOG DAYS
Nomura Securities Intl Inc, Charlie McElligott, Equity Derivatives Sales / Strategy
This is why I’ve been emphasising “Higher, then Lower” moving forward. There simply isn’t enough “net” leverage or beta exposure in play, and returns have largely underperformed the rally for most investors. My frequent observation that “nobody owned the right-tail” is clearly unfolding as we witness a V-shaped recovery back toward all-time highs. Gradual disinflation—signaling a Federal Reserve leaning incrementally more dovish, especially with the curious tone of July discussions—combined with still robust 5-6% nominal GDP growth (supported by steady aggregate consumption sustaining corporate earnings) keeps bullish momentum intact. This is happening even as we steer clear of “hard-landing” warnings, though “yellow flags” are increasingly evident in U.S. economic growth data.
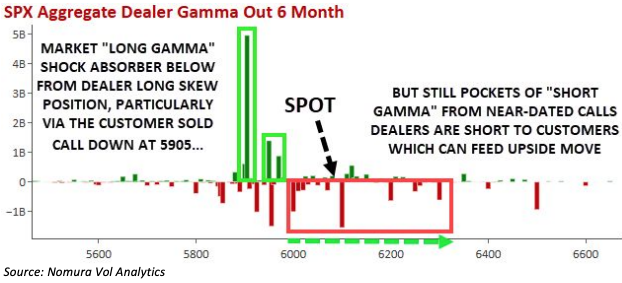
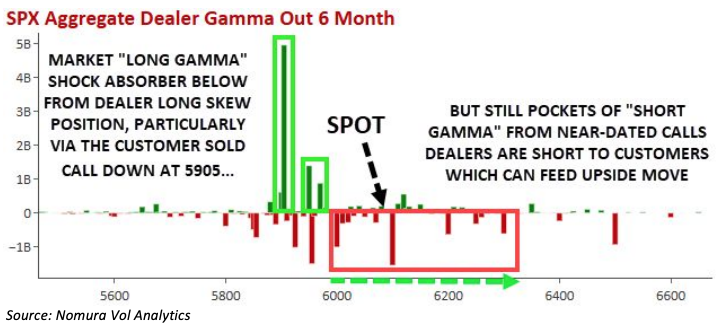
Furthermore, the current Equities Index Options Dealer positioning provides an ideal environment for absorbing shocks (e.g., potential Iran strikes) and supports a grind-higher scenario. Dealers are holding long skew positions, particularly the substantial long gamma at 5905, while also managing local short gamma in near-term upside calls. These calls continue to gain delta as the market rallies, aided by a relatively muted response to Iran tensions and the announcement of a ceasefire.
Buybacks have been a significant driver of demand over the past few months, largely due to the prevailing "Capex Uncertainty" narrative. Instead of allocating cash to R&D or hiring, companies have redirected funds toward share repurchases, pushing equities higher—much to the frustration of macro bears.
Meanwhile, volatility supply has remained substantial during the quieter summer months, driven by overwriters, underwriters, and premium income ETFs, alongside contributions from Vol Pods, Dispersion players, and the QIS VRP universe with their shadow AUM and leverage. Dealers are increasingly burdened with gamma, leading to daily price movements being pinned and resulting in pronounced realized volatility (rVol) compression. This, in turn, sets the stage for a significant volatility control reallocation flow into equities in the months ahead. For instance, a 50bps daily SPX change projected over the next month could translate into approximately $107 billion in equity buying from this "Vol Scaler" cohort.
However, as often noted, the rush to increase gross and net exposure ultimately creates conditions for a pullback. As dealers sell puts to clients who are now sufficiently long to require hedging, the market becomes vulnerable. With 3-month SPX skew and put skew sitting at the 100th percentile on a 1-year lookback, this setup could lead to "accelerant flow" during a spot selloff, driven by dealer short gamma and short vega hedging.
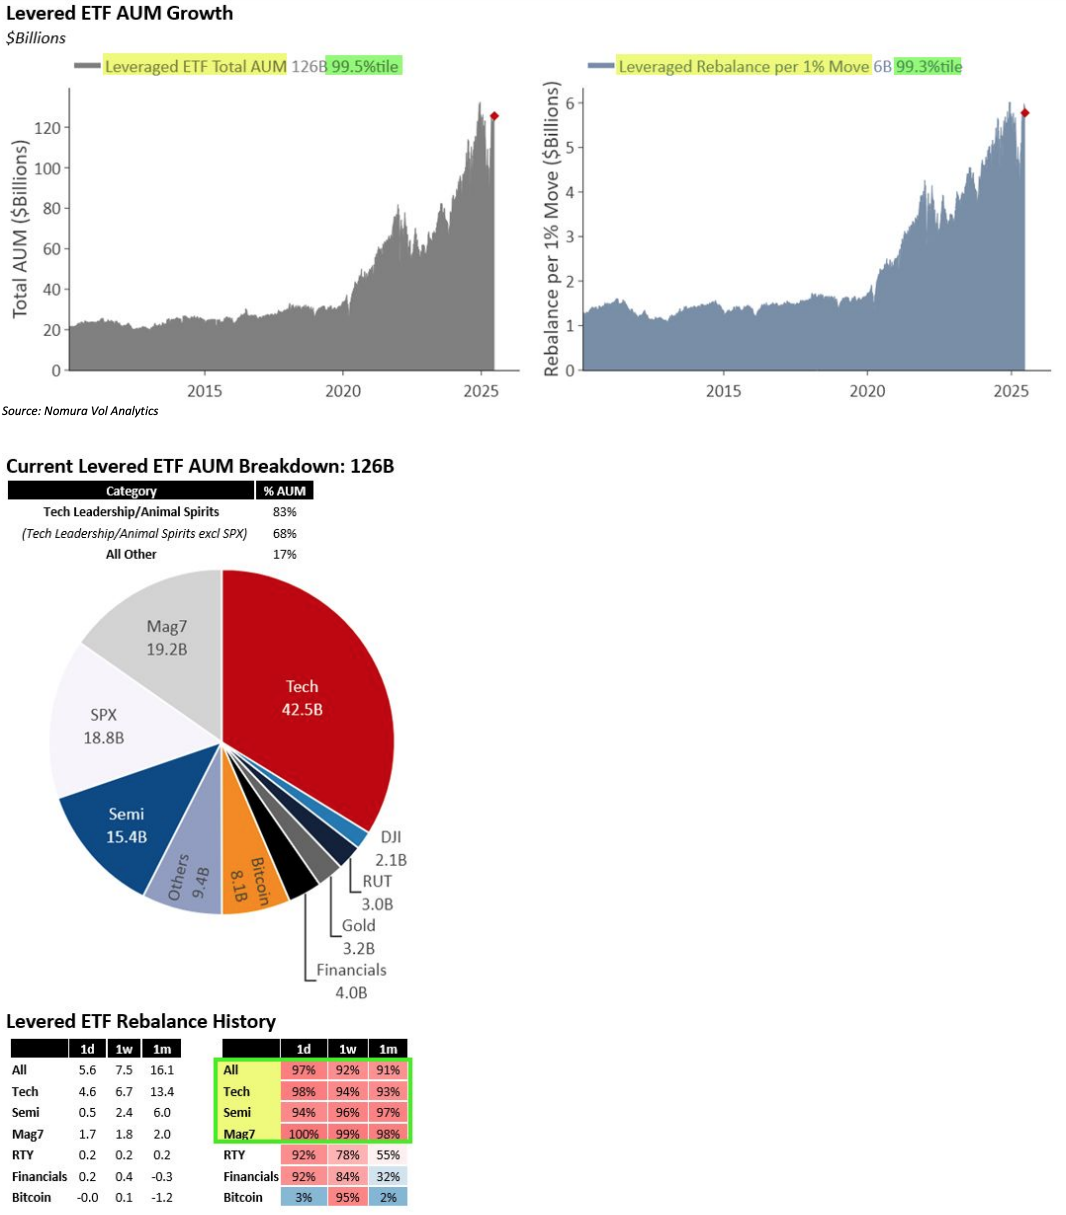
Additional risks in a potential forward selloff from "Synthetic Negative Gamma" flows in the Leveraged ETF space: With Leveraged ETF AUM currently at the 99.5th percentile historically, the implied daily rebalance requirements for Leveraged ETFs per 1% market move amount to $6 billion, ranking in the 99.3rd percentile for daily rebalance impact. This dynamic is driven by the Retail cohort, which has significantly funded these products, pushing AUM to record highs as the Spot price approaches within a few percentage points of Index all-time highs.
When SPX 3-month skew steepens significantly over a 2-week trailing period (>=0.08 / 93rd percentile) and the index is within 2% of all-time highs—as we’ve just observed—it tends to signal the following forward return dynamics:
1) Stocks exhibit weaker excess forward returns, particularly over a 1-month horizon. For example, the SPX shows a median return of -0.9%, with a notably low 38% hit rate for positive returns and a significant outlier of -22% excess return.
2) The VIX typically rises on forward projections, especially in the t+1 month window, where the median increase is +18.9%, with an 85% hit rate for higher VIX levels and 38% excess positive returns.
Additionally, as previously noted, the USD volatility surface indicates a shift among traders toward hedging for potential Fed rate cuts or lower rates, driven by mounting signs of economic slowing. The recent downturn in oil prices further supports this trend. Skewness has been pronounced, with a preference for out-of-the-money receivers over out-of-the-money payers on 1-year tails.
Regarding the “Fed cuts are bullish for equities” narrative, the context matters significantly. If rate cuts are perceived as “insurance-like” and stimulative—stemming from disinflation and a move toward policy normalization while growth remains stable with fiscal support—this could be positive for equities. However, if deeper rate cut pricing reflects economic data deteriorating into more precarious territory, particularly with U.S. growth and the labor/consumer sectors under strain, the outlook becomes far less optimistic.
Disclaimer: The material provided is for information purposes only and should not be considered as investment advice. The views, information, or opinions expressed in the text belong solely to the author, and not to the author’s employer, organization, committee or other group or individual or company.
Past performance is not indicative of future results.
High Risk Warning: CFDs are complex instruments and come with a high risk of losing money rapidly due to leverage. 69% and 73% of retail investor accounts lose money when trading CFDs with Tickmill UK Ltd and Tickmill Europe Ltd respectively. You should consider whether you understand how CFDs work and whether you can afford to take the high risk of losing your money.
Futures and Options: Trading futures and options on margin carries a high degree of risk and may result in losses exceeding your initial investment. These products are not suitable for all investors. Ensure you fully understand the risks and take appropriate care to manage your risk.
Patrick has been involved in the financial markets for well over a decade as a self-educated professional trader and money manager. Flitting between the roles of market commentator, analyst and mentor, Patrick has improved the technical skills and psychological stance of literally hundreds of traders – coaching them to become savvy market operators!