Institutional Insights: JPMorgan - Retail Radar Buy the Dip” Mentality Paid Off
.jpeg)
Overview – Retail Trading
Retail Order Imbalance
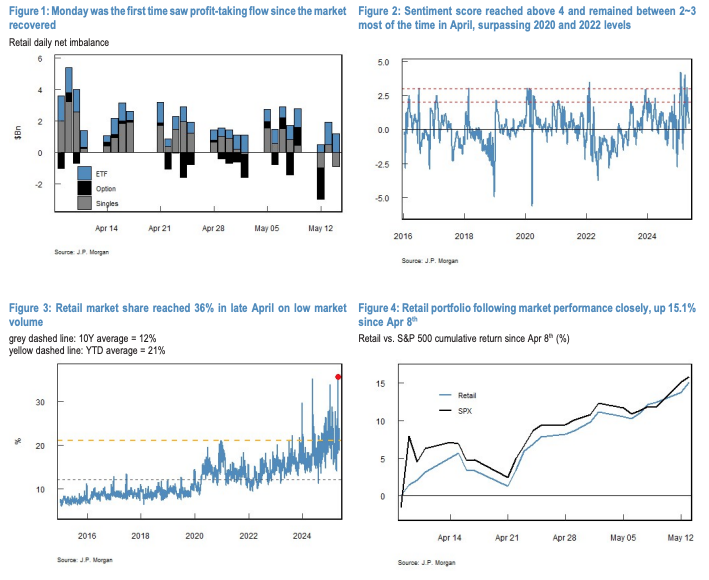
- Retail traders have net purchased $50 billion in cash equities since the market's rebound on April 8. However, profit-taking emerged this Monday, with outflows of -$555 million in cash equities (-2.7z below the 1-month average) and -$2 billion in options. Notably, NVDA experienced its largest historical outflow at -$894 million. Following Tuesday's softer inflation print, retail traders returned as aggressive buyers, contributing +$1.8 billion in cash and +$21 million in options. Buying activity continued on Wednesday, albeit at a slower pace.
- Retail sentiment scores remained between 2–3 for most of April, surpassing levels seen in 2020 and 2022. Retail traders were key drivers of the market rally in late April amid subdued institutional activity and low CTA positioning. Retail market share peaked at 36% on April 28–29, significantly above the YTD average of 21% and the long-term average of 12%.
- The buy-the-dip strategy in early April proved profitable. Retail portfolios are estimated to have gained 15.1% since April 8, closely mirroring the market's 15.8% performance. Year-to-date, retail portfolios are down slightly by 2%, compared to the market's flat performance. Historically, retail strategies of buying dips and gradual accumulation during rallies have been profitable, as seen during the 2020 COVID recovery, where retail portfolios gained 30.7% YTD, outperforming the market's 15.3% return.
- Over the past week, retail traders net bought $4.8 billion, slightly below the 1-year average (-0.2z). Market share declined to 23%, and the sentiment score dropped below 1, signaling reduced risk appetite. ETFs accounted for the entire inflow (+$4.9 billion), with strong demand for broad-market ETFs (SPY +1.2z, QQQ +2.3z). Sector rotation was evident, with shifts from Value (-0.5z) to Growth (+1.3z), Small Cap (-0.8z) to Large Cap (+1.3z), Health Care (-1.0z) to Industrials (+1.4z), and Gold/Silver (-1.8z) to base metals (+0.8z). International equities, particularly in EMEA, also remained a key theme (+2.4z).
- In individual stocks, Tech saw significant outflows (-$1.1 billion), partially offset by inflows into other sectors, resulting in a small net imbalance of -$232 million. NVDA, PLTR, and TSLA saw profit-taking flows of -$1.7 billion (-2.1z), -$840 million (-3.4z), and -$268 million (-0.5z), respectively. AAPL continues to experience heavy selling, with 31 out of the last 40 weeks showing net outflows. Conversely, the rest of the Mag7 stocks attracted strong interest (+$1.2 billion).
- Retail options activity increased over the past week, up 2% from recent lows. Retail traders net sold -$1.5 billion of delta and -$14 billion of gamma, primarily through index options such as SPY (-$1.5 billion), QQQ (-$764 million), and IWM (-$108 million) as part of cash position hedging. Short-dated volatility selling in S&P 500 and QQQ persisted, contributing 85% of market-wide gamma supply.
- Retail trading volumes for large caps rose slightly (+0.3% to 13.8%), while SMid-cap volumes declined (-1.5% to 20.9%). Large-cap volumes remain elevated, exceeding the 98th percentile in long-term history.
Non-Retail Order Imbalance
- Institutional investors net sold -$11 billion during market hours (-0.4z) but bought +$6.9 billion in MOC trades. Futures traders net purchased $1 billion, driven by massive buying in NQ (+$3.2 billion), which offset selling in RTY (-$1.4 billion) and ES (-$716 million).
Disclaimer: The material provided is for information purposes only and should not be considered as investment advice. The views, information, or opinions expressed in the text belong solely to the author, and not to the author’s employer, organization, committee or other group or individual or company.
Past performance is not indicative of future results.
High Risk Warning: CFDs are complex instruments and come with a high risk of losing money rapidly due to leverage. 69% and 73% of retail investor accounts lose money when trading CFDs with Tickmill UK Ltd and Tickmill Europe Ltd respectively. You should consider whether you understand how CFDs work and whether you can afford to take the high risk of losing your money.
Futures and Options: Trading futures and options on margin carries a high degree of risk and may result in losses exceeding your initial investment. These products are not suitable for all investors. Ensure you fully understand the risks and take appropriate care to manage your risk.
Patrick has been involved in the financial markets for well over a decade as a self-educated professional trader and money manager. Flitting between the roles of market commentator, analyst and mentor, Patrick has improved the technical skills and psychological stance of literally hundreds of traders – coaching them to become savvy market operators!