Institutional Insights: JPMorgan - Global Equity Index Technical Chartbook
.jpeg)
JPMorgan - Global Equity Index Technical Chartbook
Most global rebounds have paused or at least decelerated, which raises the prospects for consolidation
Most of the major global indices have rebounded from their April lows. However, recent weeks have seen these rebounds either consolidating or extending at a slower and more cautious pace. While some markets have not yet reacted to momentum divergence sell signals now visible on their charts, historical trends associated with such signals suggest an increased likelihood of short-term consolidation in these markets as well.
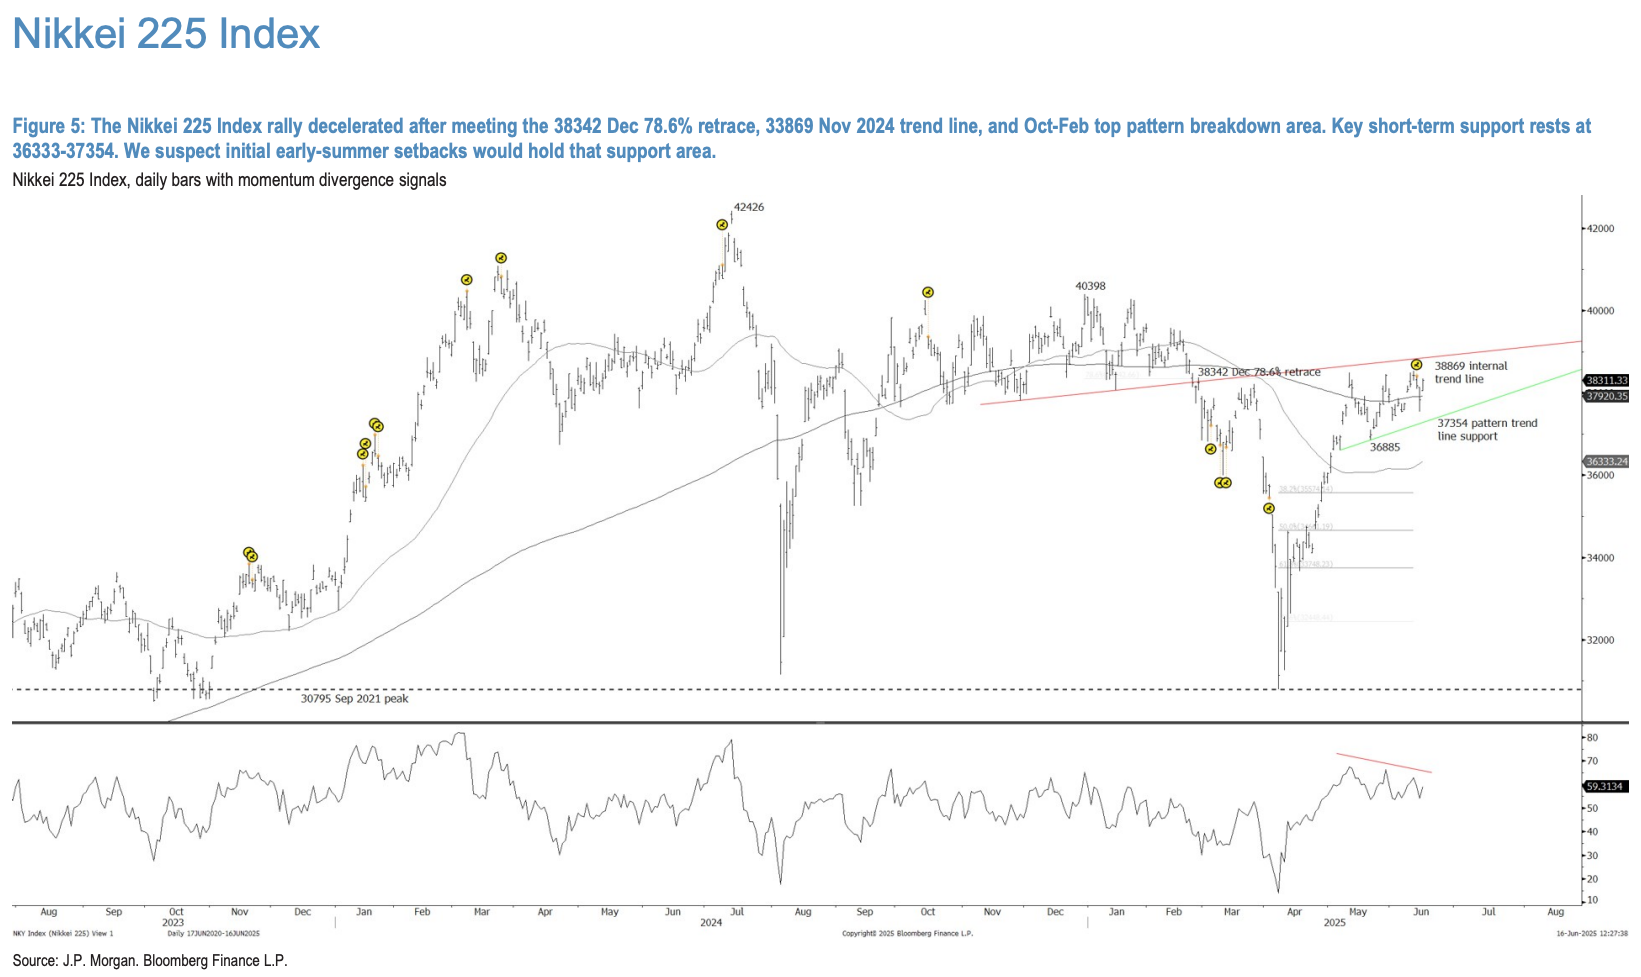
If early-summer price weakness emerges, we believe initial declines toward noted support levels could offer attractive short-term buying opportunities. However, the risk of a more extended downturn increases as we approach late August, coinciding with a shift to negative seasonality.
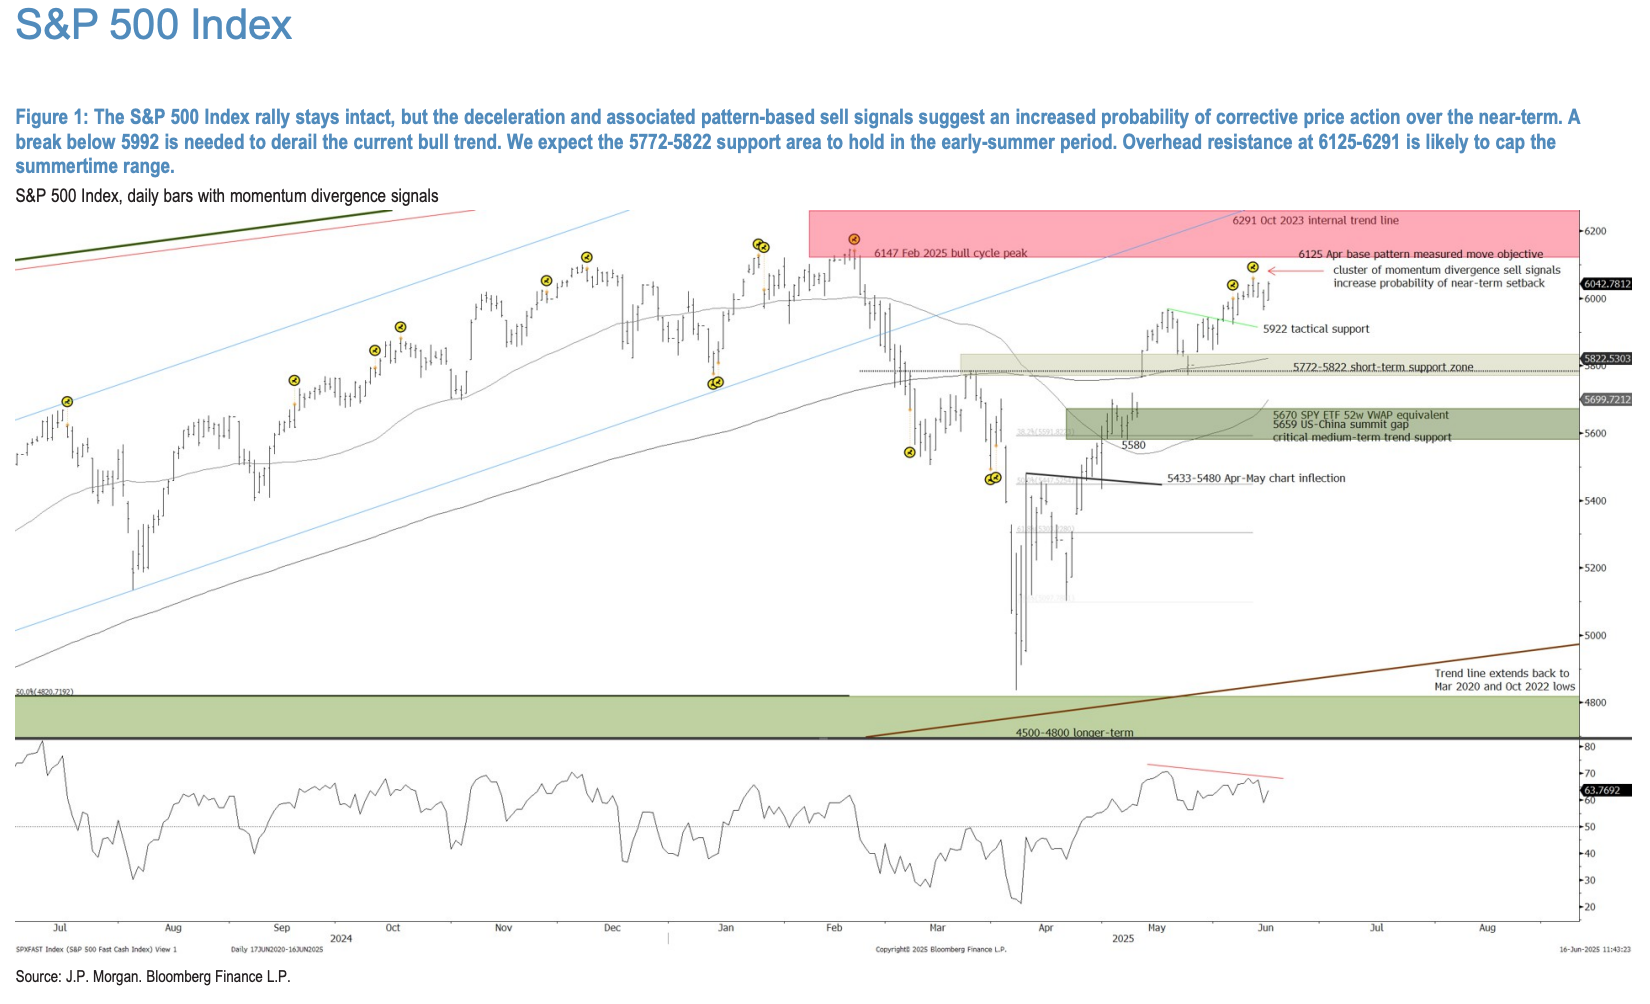
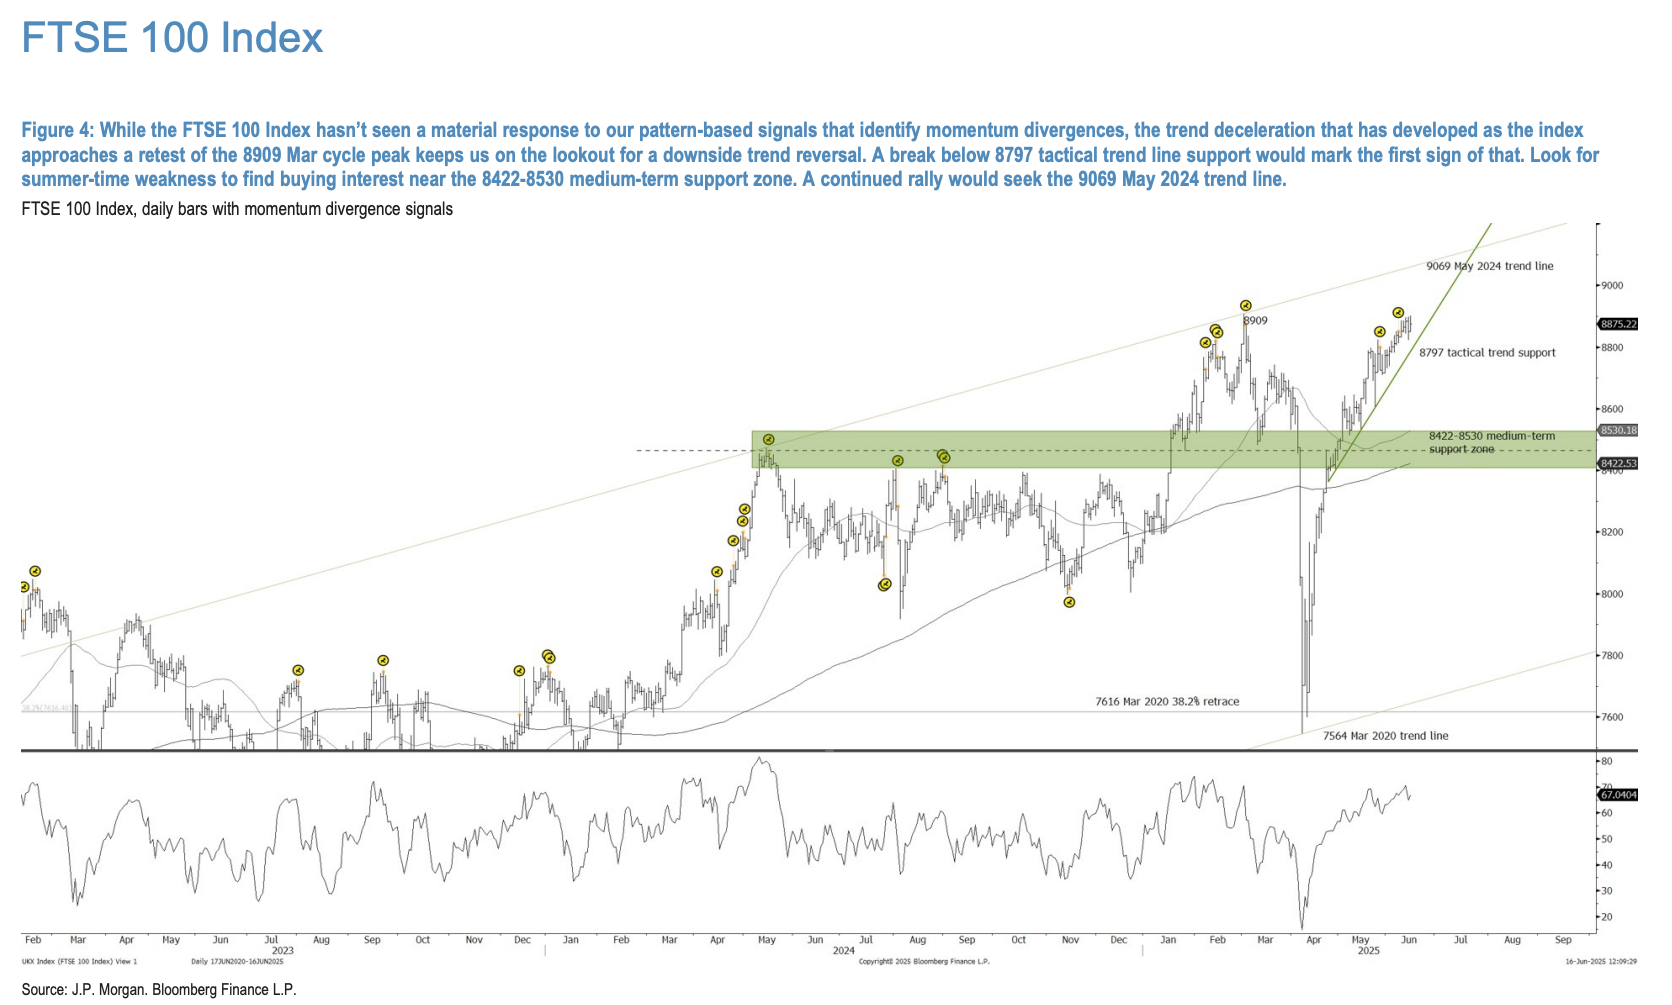
In developed markets (DM), the S&P 500 Index is expected to trade within a range above key support around 5800 and below resistance at 6125-6291. We will closely monitor for signs of a more significant distribution pattern below the resistance zone as summer progresses. Such a development could indicate the formation of a potential double top pattern, with the February peak at 6142 acting as a critical level ahead of the seasonally weaker September-October period. The technical setup of the FTSE 100 Index shows similarities to that of the U.S. large-cap index.
In emerging markets (EM), the CSI 300 Index and Ibovespa Index are both exhibiting bullish consolidation patterns following their April-May rebound rallies. These patterns suggest the potential for further extensions to new rally highs later this summer. Conversely, the MEXBOL Index appears to have formed a potential short-term top pattern below key resistance, signaling the likelihood of a broader retracement of its 2025 rally. A breakout from the first-quarter half pattern may establish a floor for this market.
Disclaimer: The material provided is for information purposes only and should not be considered as investment advice. The views, information, or opinions expressed in the text belong solely to the author, and not to the author’s employer, organization, committee or other group or individual or company.
Past performance is not indicative of future results.
High Risk Warning: CFDs are complex instruments and come with a high risk of losing money rapidly due to leverage. 69% and 73% of retail investor accounts lose money when trading CFDs with Tickmill UK Ltd and Tickmill Europe Ltd respectively. You should consider whether you understand how CFDs work and whether you can afford to take the high risk of losing your money.
Futures and Options: Trading futures and options on margin carries a high degree of risk and may result in losses exceeding your initial investment. These products are not suitable for all investors. Ensure you fully understand the risks and take appropriate care to manage your risk.
Patrick has been involved in the financial markets for well over a decade as a self-educated professional trader and money manager. Flitting between the roles of market commentator, analyst and mentor, Patrick has improved the technical skills and psychological stance of literally hundreds of traders – coaching them to become savvy market operators!