Institutional Insights: Goldman Sachs SP500 Positioning & Key Levels 16/7/25

US Equity Positioning and Key Levels
FICC and Equities
Consolidated Recap of GS Positioning Metrics
Summary:
1. CTA Corner:
- Over the past week, global equity buying is estimated at $25bn.
- For the upcoming week, projections indicate $31bn in buying.
- Cumulatively for the next month, $132bn is expected under the baseline scenario.
- Of this, $100bn is attributed to CTA/trend followers, while the remaining $32bn is driven by vol-based investors (VA vol-control and risk parity styles).
- Regional breakdown: $48bn (37%) of the monthly figure is anticipated in US markets.
2. GS PB Performance:
- Equity Fundamental L/S Performance Estimate: Increased by +0.22% between 7/4 and 7/10, outperforming MSCI World TR (+0.03%). Gains were driven by beta (+0.13%) and alpha (+0.08%) from long-side positions.
- Equity Systematic L/S Performance Estimate: Declined for the fifth consecutive week (-0.53%) during the same period, impacted by alpha losses (-0.34%) from short-side positions and beta (-0.19%).
3. Buybacks:
- Companies remain within the estimated blackout window through 7/25.
- Open windows are expected to resume ~1-2 days post-earnings announcements.
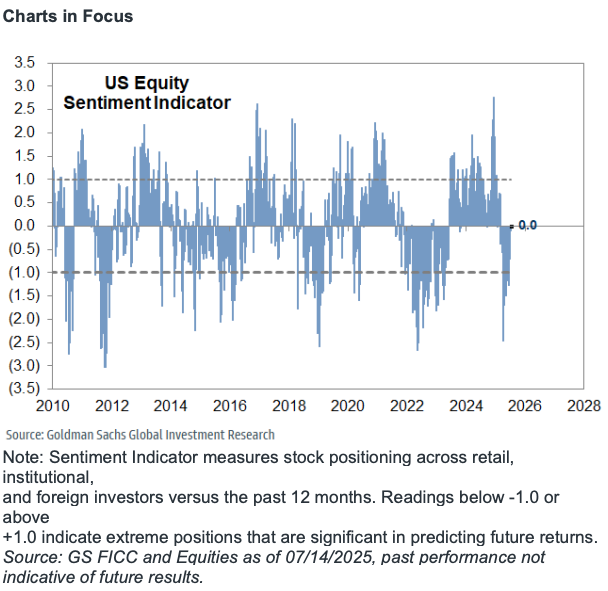
4. Charts in Focus:
- Sentiment Indicator, US Panic Index, Risk Appetite Indicator, SPX vs. Singles Skew, Call Skew vs. Put Skew, S&P Futures Liquidity, Funding Spreads vs. S&P 500.
CTA Corner – Detailed Flows:
- Next 1 Week Projections:
- Flat tape: $21.73B buyers ($5.00B into US markets).
- Up tape: $20.46B buyers ($4.14B into US markets).
- Down tape: $6.53B sellers ($2.51B out of US markets).
- Next 1 Month Projections:
- Flat tape: $92.45B buyers ($30.18B into US markets).
- Up tape: $96.60B buyers ($28.82B into US markets).
- Down tape: $140.20B sellers ($40.17B out of US markets).
Key Pivot Levels for SPX:
- Short-term: 6035
- Medium-term: 5901
- Long-term: 5642
Disclaimer: The material provided is for information purposes only and should not be considered as investment advice. The views, information, or opinions expressed in the text belong solely to the author, and not to the author’s employer, organization, committee or other group or individual or company.
Past performance is not indicative of future results.
High Risk Warning: CFDs are complex instruments and come with a high risk of losing money rapidly due to leverage. 69% and 73% of retail investor accounts lose money when trading CFDs with Tickmill UK Ltd and Tickmill Europe Ltd respectively. You should consider whether you understand how CFDs work and whether you can afford to take the high risk of losing your money.
Futures and Options: Trading futures and options on margin carries a high degree of risk and may result in losses exceeding your initial investment. These products are not suitable for all investors. Ensure you fully understand the risks and take appropriate care to manage your risk.
Patrick has been involved in the financial markets for well over a decade as a self-educated professional trader and money manager. Flitting between the roles of market commentator, analyst and mentor, Patrick has improved the technical skills and psychological stance of literally hundreds of traders – coaching them to become savvy market operators!