Institutional Insights: Goldman Sachs SP500 Positioning & Key Levels 10/06/25
US Equity Positioning and Key Levels
FICC and Equities | 9 June 2025
Consolidated Recap of GS Positioning Metrics
Summary:
1. CTA Corner:
- Global estimates remain relatively benign across the board, except for RTY. CTAs continue to hold a net short position of $1.8bn in RTY. Projections suggest this cohort will purchase approximately $2.5bn over the next week and $5.2bn over the next month.
2. GS PB Performance:
- The GS Equity Fundamental Long/Short (L/S) Performance Estimate increased by +1.29% between 5/30 and 6/5, outperforming MSCI World TR (+0.73%). This gain was driven by alpha (+0.96%) from long-side positions and beta (+0.33%).
- The GS Equity Systematic L/S Performance Estimate remained flat during the same period, as gains on the long side were offset by losses on the short side.
3. Buybacks:
- Blackout periods are anticipated to begin around 6/16, with approximately 40% of companies expected to enter blackout. This is estimated to end around 7/25.
4. Charts in Focus:
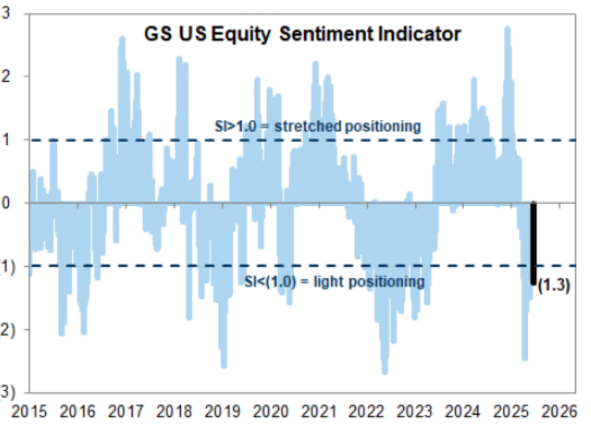
- Sentiment Indicator
- US Panic Index
- Risk Appetite Indicator
- SPX vs. Singles Skew
- Call Skew vs. Put Skew
- S&P Futures Liquidity
- Funding Spreads vs. S&P 500
CTA Corner Details
CTA Flows:
- Next 1 Week:
- Flat tape: Buyers $2.77B ($2.40B into the US)
- Up tape: Buyers $1.14B ($2.13B into the US)
- Down tape: Sellers $9.99B ($1.41B out of the US)
- Next 1 Month:
- Flat tape: Buyers $8.19B ($5.79B into the US)
- Up tape: Buyers $7.88B ($5.50B into the US)
- Down tape: Sellers $119.33B ($34.36B out of the US)
Key Pivot Levels for SPX:
- Short-term: 5786
- Medium-term: 5793
- Long-term: 5554
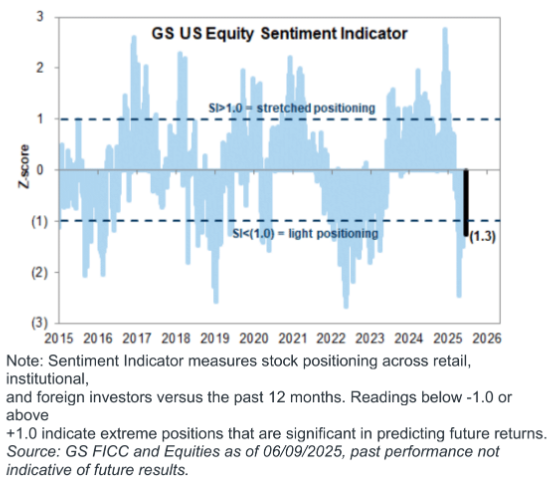
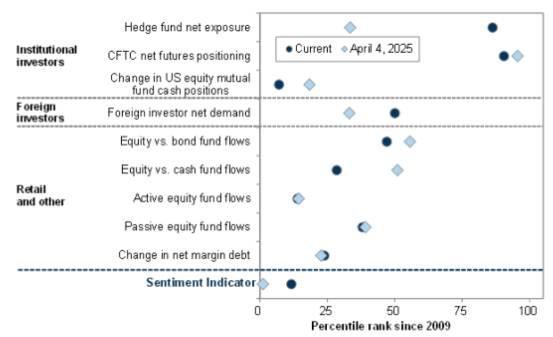
Our indicator has progressed since its lowest reading, showing mostly an increase in hedge fund net exposure, yet lacking wider support from other investor groups.
There has been a noticeable easing in the volatility market... The SPX put-call skew experienced one of its largest single-day drops in several years. In other words, clients are actively seeking upside through call options... The SPX call open interest is nearly at all-time highs ahead of next week's expiration... The SPX term structure (1-month vs. 3-month implied volatility) is at near multi-year lows. Consequently, our US Vol Panic index has fallen to a 4 out of 10.
Disclaimer: The material provided is for information purposes only and should not be considered as investment advice. The views, information, or opinions expressed in the text belong solely to the author, and not to the author’s employer, organization, committee or other group or individual or company.
Past performance is not indicative of future results.
High Risk Warning: CFDs are complex instruments and come with a high risk of losing money rapidly due to leverage. 69% and 73% of retail investor accounts lose money when trading CFDs with Tickmill UK Ltd and Tickmill Europe Ltd respectively. You should consider whether you understand how CFDs work and whether you can afford to take the high risk of losing your money.
Futures and Options: Trading futures and options on margin carries a high degree of risk and may result in losses exceeding your initial investment. These products are not suitable for all investors. Ensure you fully understand the risks and take appropriate care to manage your risk.
Patrick has been involved in the financial markets for well over a decade as a self-educated professional trader and money manager. Flitting between the roles of market commentator, analyst and mentor, Patrick has improved the technical skills and psychological stance of literally hundreds of traders – coaching them to become savvy market operators!