Institutional Insights: Goldman Sachs - SP500 Positioning and Key Levels 20/05/25
.jpeg)
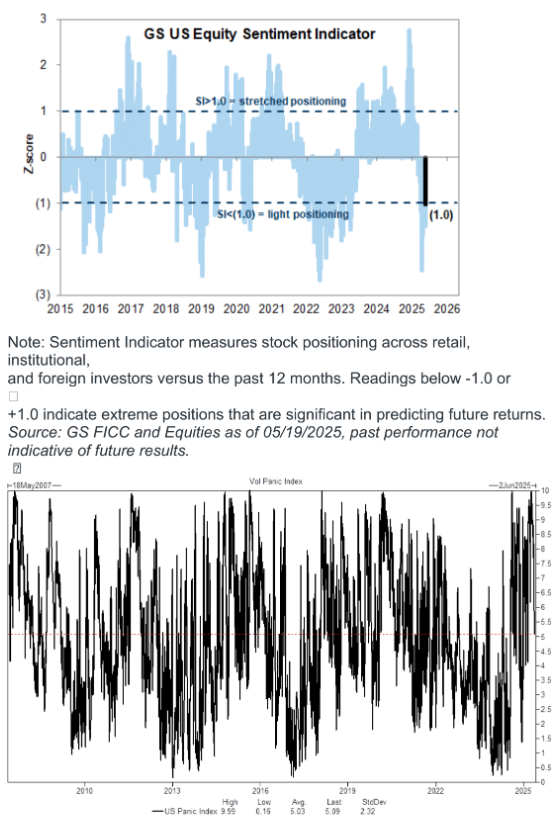
US Equity Positioning and Key Levels
FICC and Equities
19 May 2025 |
Consolidated Recap of GS Positioning Metrics
Summary:
1. CTA Corner:
- Systematic macro investors have repurchased approximately $165 billion in global equities over the past month, following $380 billion in sales during the market downturn. This has brought positioning to around 4 out of 5.
- Anticipated baseline buying for the next month is estimated at $30 billion, with $24 billion expected in U.S. markets.
2. GS PB Performance:
- The GS Equity Fundamental Long/Short Performance Estimate increased by +0.99% between May 9 and May 15 (compared to MSCI World TR +3.70%). Performance was driven by a beta contribution of +1.82%, offset by alpha losses of -0.84% from the long side.
- The GS Equity Systematic Long/Short Performance Estimate rose by +0.15% during the same period, supported by positive beta, with alpha remaining approximately flat.
3. Buybacks:
- Flows were 1.1x higher than 2024 YTD ADTV and 1.6x higher than 2023 YTD ADTV. While YTD buyback authorizations have reached all-time highs, enabling corporates to purchase additional shares, this has not yet translated into significant execution increases on our desk.
CTA Corner Details:
- CTA Flows (Next 1 Week):
- Flat tape: Buyers $14.63B ($13.19B in U.S.)
- Up tape: Buyers $14.10B ($14.09B in U.S.)
- Down tape: Buyers $3.60B ($9.43B in U.S.)
- CTA Flows (Next 1 Month):
- Flat tape: Buyers $17.81B ($17.02B in U.S.)
- Up tape: Buyers $21.19B ($19.61B in U.S.)
- Down tape: Sellers $98.45B ($18.00B out of U.S.)
Key SPX Pivot Levels:
- Short-term: 5650
- Medium-term: 5754
- Long-term: 5503
Disclaimer: The material provided is for information purposes only and should not be considered as investment advice. The views, information, or opinions expressed in the text belong solely to the author, and not to the author’s employer, organization, committee or other group or individual or company.
Past performance is not indicative of future results.
High Risk Warning: CFDs are complex instruments and come with a high risk of losing money rapidly due to leverage. 69% and 73% of retail investor accounts lose money when trading CFDs with Tickmill UK Ltd and Tickmill Europe Ltd respectively. You should consider whether you understand how CFDs work and whether you can afford to take the high risk of losing your money.
Futures and Options: Trading futures and options on margin carries a high degree of risk and may result in losses exceeding your initial investment. These products are not suitable for all investors. Ensure you fully understand the risks and take appropriate care to manage your risk.
Patrick has been involved in the financial markets for well over a decade as a self-educated professional trader and money manager. Flitting between the roles of market commentator, analyst and mentor, Patrick has improved the technical skills and psychological stance of literally hundreds of traders – coaching them to become savvy market operators!