Institutional Insights: Goldman Sachs Sep Flow of Funds Update
Here's a structured technical checklist and analysis for the September back-to-school season in the financial market:
## September Technical Checklist
### Key Areas of Focus
1. Positioning
- Institutional
- Retail
- Foreign Investors
2. Seasonality
- Historically, September is the seasonally worst month of the year.
3. Fund Flows
- Observations indicate that systematic demand has dried up, impacting market support.
4. CTAs Vol Control
- Monitoring of volatility control by Commodity Trading Advisors (CTAs).
5. Funding Spreads
- Analysis of the differences in funding costs.
6. Gamma
- Understanding the implications of gamma on market movements.
7. Correlation
- Current low correlation levels affecting market dynamics.
8. All Things Volatility
- Comprehensive view on volatility trends and expectations.
### Market Overview
- Challenging Environment:
- The second half of September typically brings the worst two-week period of the year.
- Institutions have net sold U.S. equities for two consecutive months, indicating a cautious outlook.
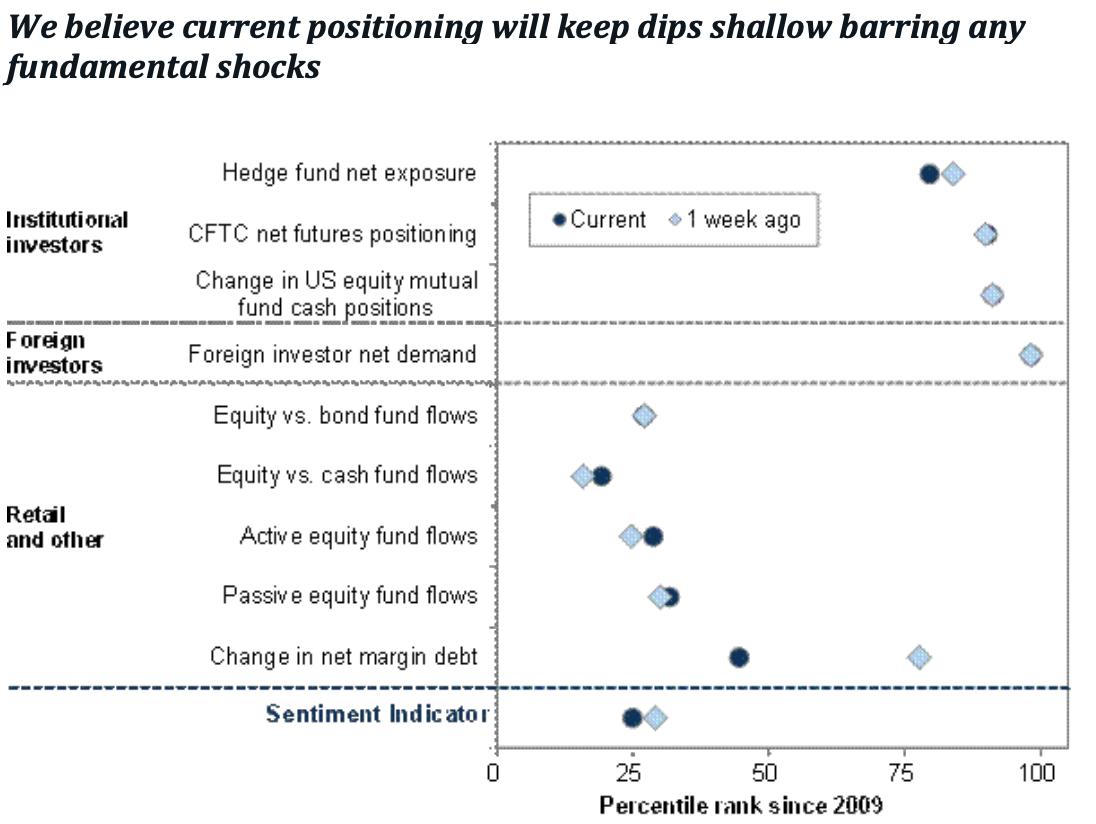
- Despite this, positioning remains modest relative to historical norms, which may limit the extent of dips unless fundamental shocks occur.
- Market Dynamics:
- Low correlation and dealers being long gamma suggest muted movements at the index level.
- Active stock-picking is expected to dominate institutional strategies, while retail investors continue to favor passive funds.
### Options Strategy
- QQQ 1m 98-88% Put Spreads:
- To protect against potential downside in the market:
- Cost: 98 basis points as of Friday’s close (reference price: 570.40).
- Structure:
- Buy 1x -32d, 18.48 volatility.
- Sell 1x -5d, 28.65 volatility.
- Breakeven Point: $553.418 (-2.977%).
### Institutional Positioning Insight
- GS Sentiment Indicator:
- Despite a recent rally, the GS Sentiment Indicator remains negative.
- Historical flow analysis shows that positioning is still relatively balanced.
- Most cohorts in the model have capacity to add length, indicating potential for future market adjustments.
Here's a detailed summary of the current Private Banking (PB) activity regarding leverage metrics:
## PB Activity Overview
### Leverage Metrics
- Overall PB Book:
- Gross Leverage: Near 1-year average, positioned at the 89th percentile over a 5-year period.
- Net Leverage: Also near 1-year average, at the 59th percentile over a 5-year period.
### Fundamental Long/Short (L/S) Analysis
- Net Leverage Trends:
- Fundamental Long/Short Net leverage has seen a sharp increase in recent months but has remained relatively flat in August.
- Current levels are still below the year-to-date (YTD) high recorded in February.
- Monthly Changes:
- US Fundamental L/S Gross Leverage: Increased by +3.6 percentage points (pts) month-to-date (MTD).
- US Fundamental L/S Net Leverage: Decreased by -0.5 pts MTD.
### Risk Appetite and Directional Bias
- The increase in Gross leverage suggests a growing risk appetite among investors.
- Conversely, the modest decline in Net leverage indicates a slight reduction in directional bias.
### Percentile Rankings
- US L/S Gross Leverage: Remains elevated, currently at the 97th percentile on a 5-year lookback, indicating a high level of leverage relative to historical norms.
- US L/S Net Leverage: Below average, positioned at the 32nd percentile, reflecting a more cautious stance among investors.
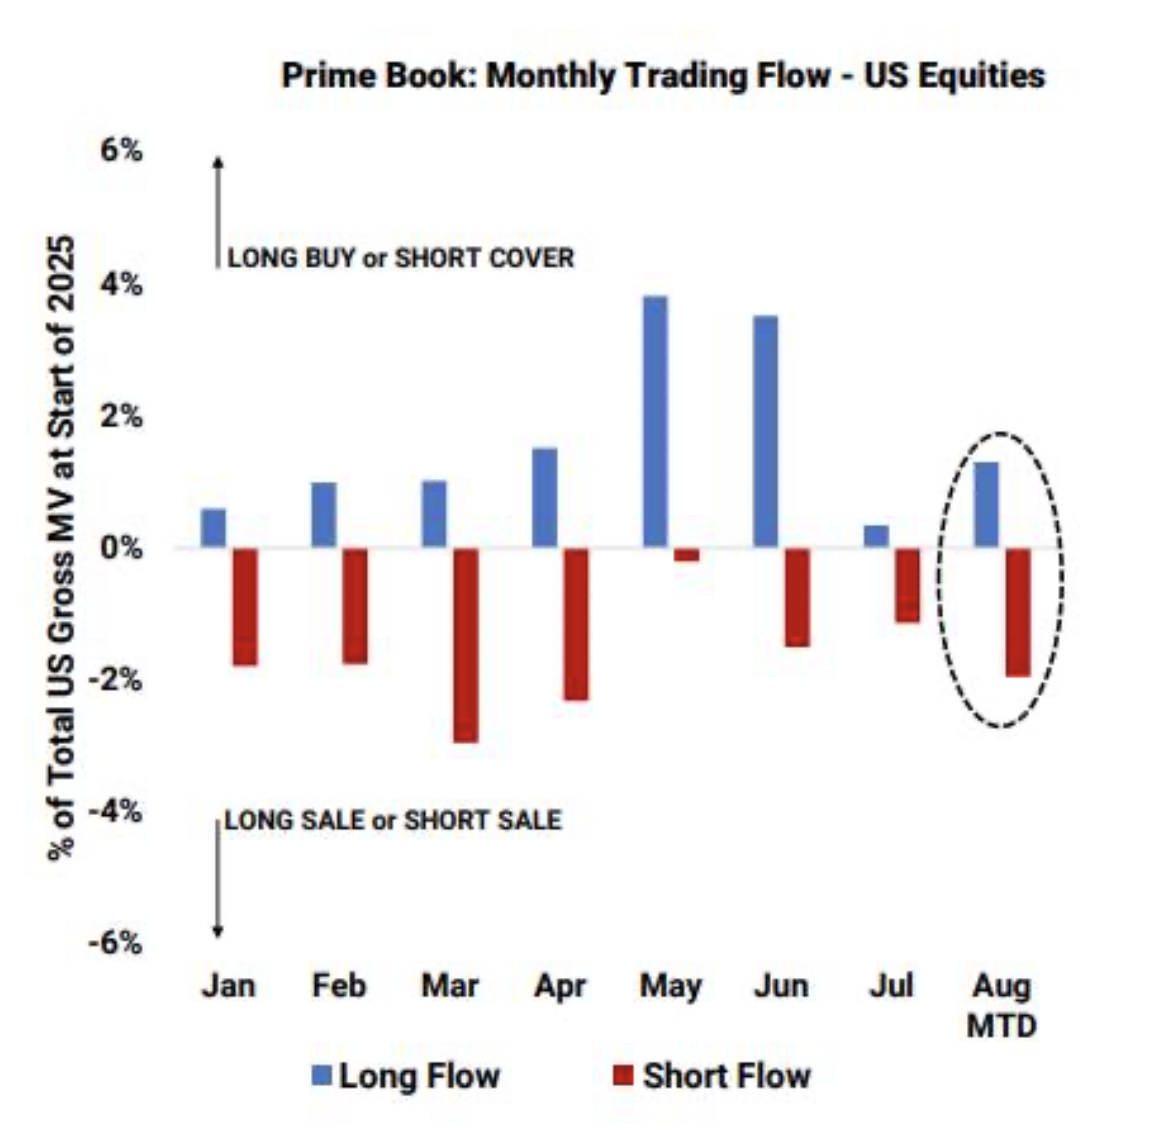
Despite continued market rally, HFs are on track to sell US equities for a second consecutive month, driven by short sales outpacing long buys across both Macro Products and Single Stocks, which points to a more cautious stance going into September
Hedge Fund Activity in Emerging Markets
Key Highlights
Aggressive Rotation into EM Stocks:
Hedge funds have significantly shifted their focus towards emerging market stocks, with a notable emphasis on Chinese equities over the past month.
Notional Net Buying Flows:
Current notional net buying flows for broader EM and China on the Prime book are projected to be the largest on record, representing a +3 sigma move compared to the last 10 years.
This surge is primarily driven by long buying activities.
Focus on China
Bullish Flows:
There has been a strong influx of bullish flows into the Chinese market, particularly concentrated in:
China Tech ETFs
Megacap Names: Notably, Alibaba (BABA) has attracted significant interest.
Regional Focus:
The rest of the world (RoW) is gaining renewed attention, indicating a broader interest in global market dynamics
September Seasonality Overview
September Scaries
As summer ends and fall begins, market participants often experience the "September Scaries," a term reflecting the historical challenges associated with this month in financial markets.
Historical Performance of the S&P 500
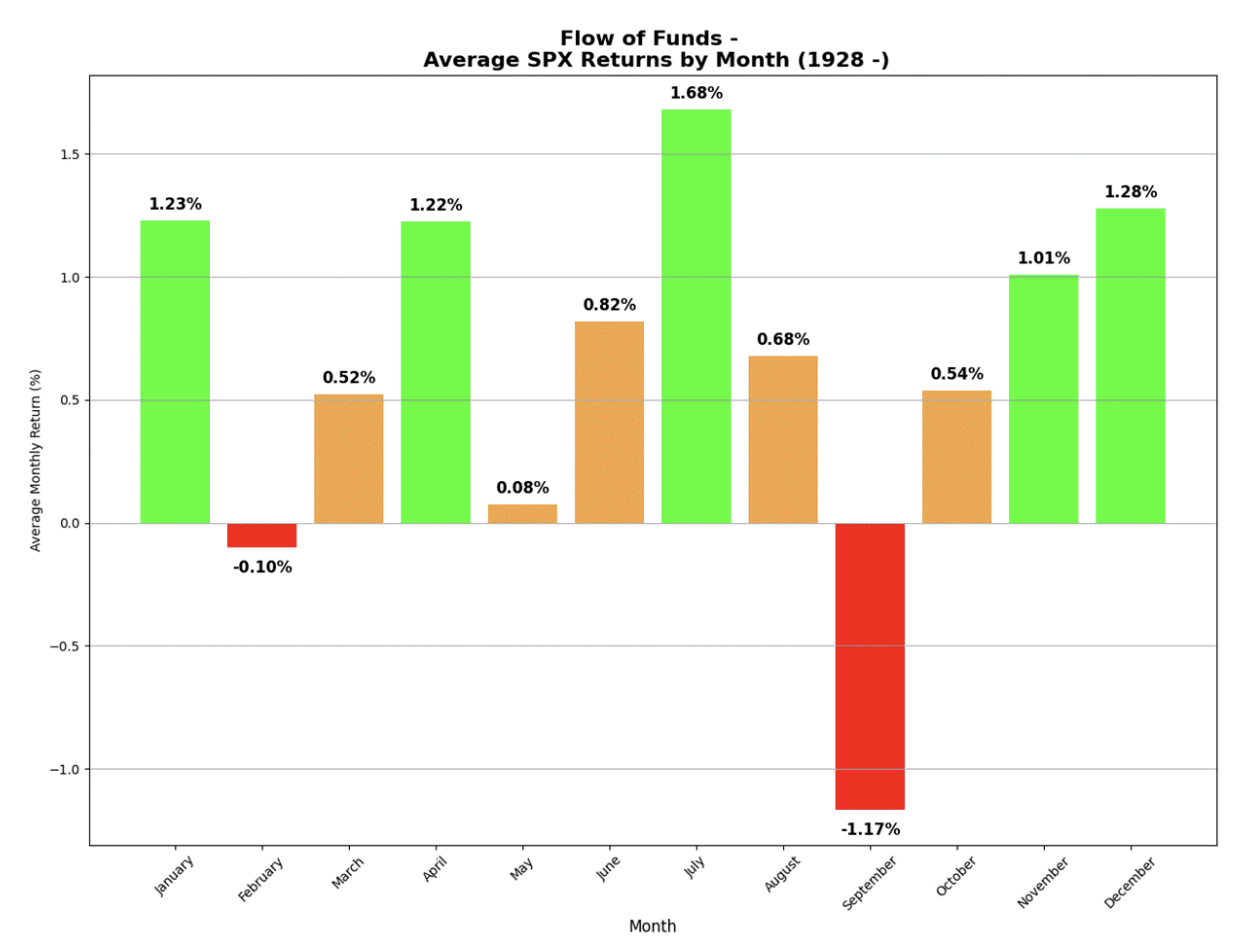
Worst Month of the Year:
September holds the distinction of being the worst month for the S&P 500, based on historical performance data.
Average Return:
The average return for the S&P 500 in September is -1.17%, when looking back to 1928. This negative return underscores the month’s reputation for market volatility and downturns.
Implications for Investors
Caution Recommended:
Given the historical trends, investors may want to approach September with caution, considering potential market volatility and the typical performance patterns.
Strategic Adjustments:
It may be prudent for investors to review their portfolios and consider adjustments to mitigate risks associated with this historically challenging month.
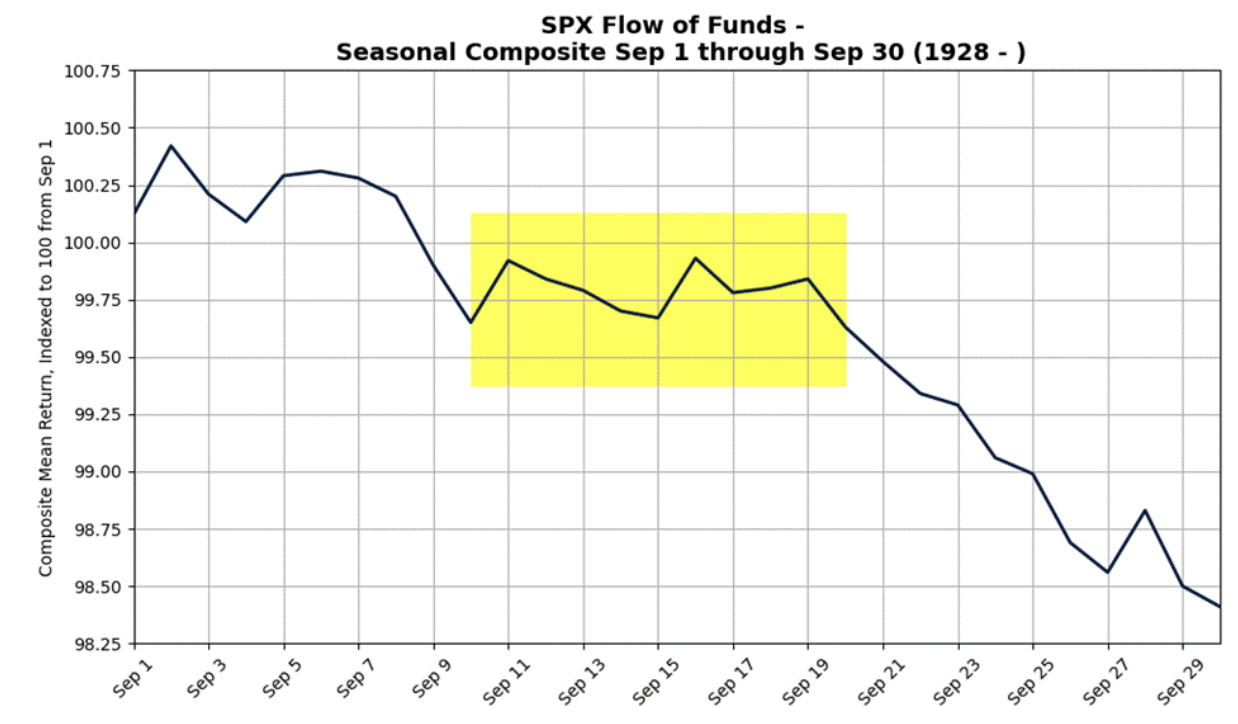
The second half of September historically stands out as the worst two-week period of the year, averaging a return of -1.38% since 1928. In contrast, the first half tends to be more stable, characterized by milder fluctuations. We anticipate this trend will shape early trading this month, largely influenced by current market positioning.
CTAs Update:
- Current Positioning: CTA positioning in US equities has reached the 100th percentile, indicating it is fully maxed out. While this doesn’t present an active headwind for equities, it suggests diminished supportive flows during a historically weak month.
- August Activity: According to our GS model, CTAs purchased $12.56 billion worth of US equities in August, marking a significant drop from July’s $27.66 billion.
- September Outlook: For September, the model predicts even lower activity, with CTAs expected to buy just $2.96 billion worth of US equities over the month.
1-Week Projections:
- Flat tape: Global Buyers $1.67B ($1.33B into the US)
- Up tape: Global Buyers $0.60B ($0.73B into the US)
- Down tape: Global Sellers $22.25B ($4.84B out of the US)
1-Month Projections:
- Flat tape: Global Sellers $1.79B ($2.96B into the US)
- Up tape: Global Buyers $11.13B ($3.55B into the US)
- Down tape: Global Sellers $217.92B ($73.69B out of the US)
The cohort is projected to make modest purchases over the next month; however, there is a significant downside risk, with $73.69 billion in US equities potentially being sold in a declining market.
Vol Control:
Implied and realized volatility levels are near one-year lows, prompting Vol Control funds to significantly increase their exposure.
As of April 15th, these funds held $74.01B in US equities, which surged to $170.91B by August 30th.
Funding Spreads:
S&P funding increased significantly, rising from 56.28 basis points on May 1st to 77.99 basis points—a sharp 38.57% jump.
The recent market rally has amplified leverage levels among institutional and systematic investors. We will continue to monitor funding spreads closely.
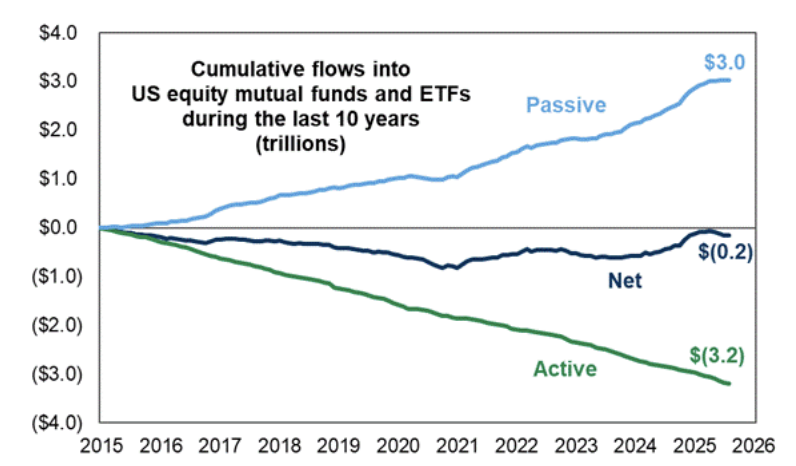
Fund Flows:
Retail investors have become increasingly active in influencing individual stocks, yet they remain predominantly committed to passive funds.
The growing preference for passive investing among retail investors is amplifying the divide between active and passive funds. Due to the structure of ETFs, a significant portion of these investments continues to be heavily concentrated in the Magnificent 7 (Mag7).
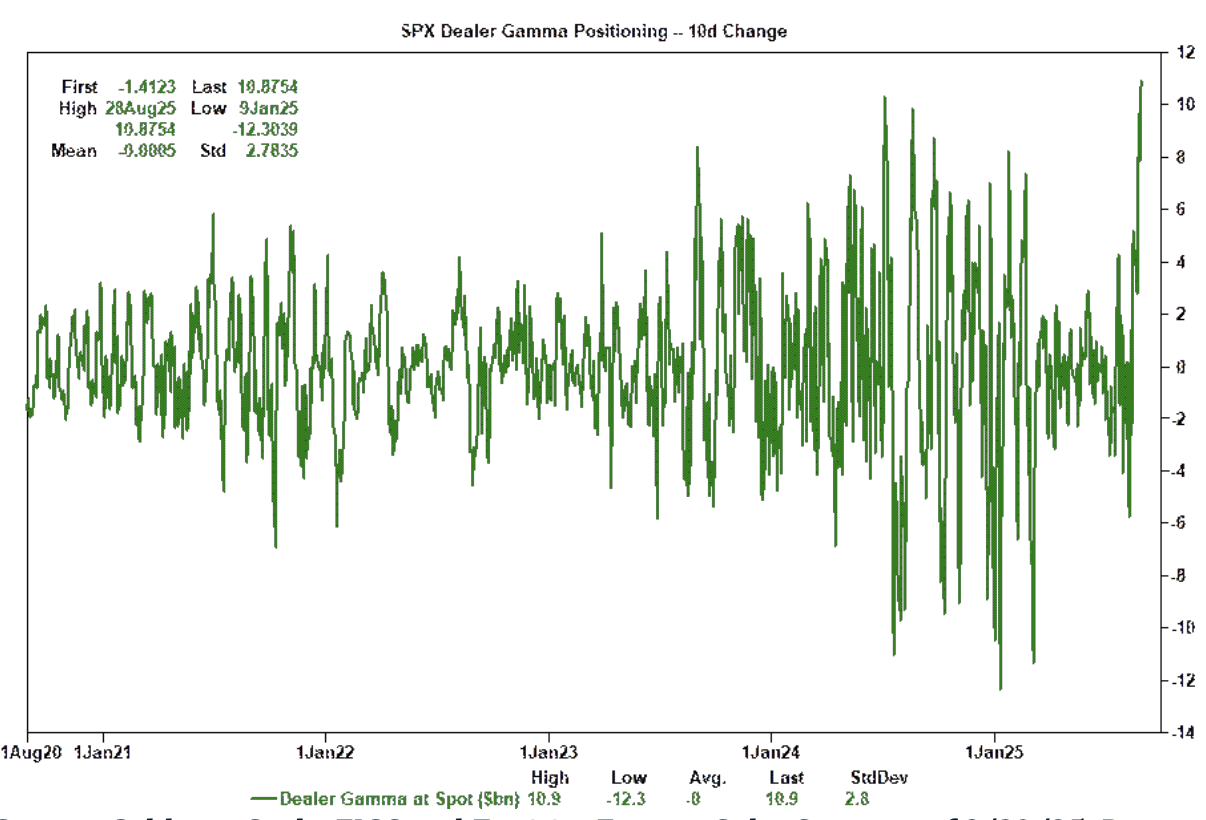
Got Gamma?
Dealers appear to be long gamma, likely keeping the market rangebound at the index level. The 10-day change in dealer gamma positioning has seen the largest increase on record, reaching $10.9 billion. The current gamma pocket serves as a market buffer, providing support during selloffs.
Volatility
Just when it seems like it can't drop any lower, it does.
S&P 1-month implied volatility levels are hovering just above 1-year lows, appearing extremely undervalued, especially when factoring in all of September’s scheduled calendar events — and even the unscheduled ones.
Disclaimer: The material provided is for information purposes only and should not be considered as investment advice. The views, information, or opinions expressed in the text belong solely to the author, and not to the author’s employer, organization, committee or other group or individual or company.
Past performance is not indicative of future results.
High Risk Warning: CFDs are complex instruments and come with a high risk of losing money rapidly due to leverage. 69% and 73% of retail investor accounts lose money when trading CFDs with Tickmill UK Ltd and Tickmill Europe Ltd respectively. You should consider whether you understand how CFDs work and whether you can afford to take the high risk of losing your money.
Futures and Options: Trading futures and options on margin carries a high degree of risk and may result in losses exceeding your initial investment. These products are not suitable for all investors. Ensure you fully understand the risks and take appropriate care to manage your risk.
Patrick has been involved in the financial markets for well over a decade as a self-educated professional trader and money manager. Flitting between the roles of market commentator, analyst and mentor, Patrick has improved the technical skills and psychological stance of literally hundreds of traders – coaching them to become savvy market operators!