EUR/USD Forecast: The Long-Awaited Price Correction Ahead

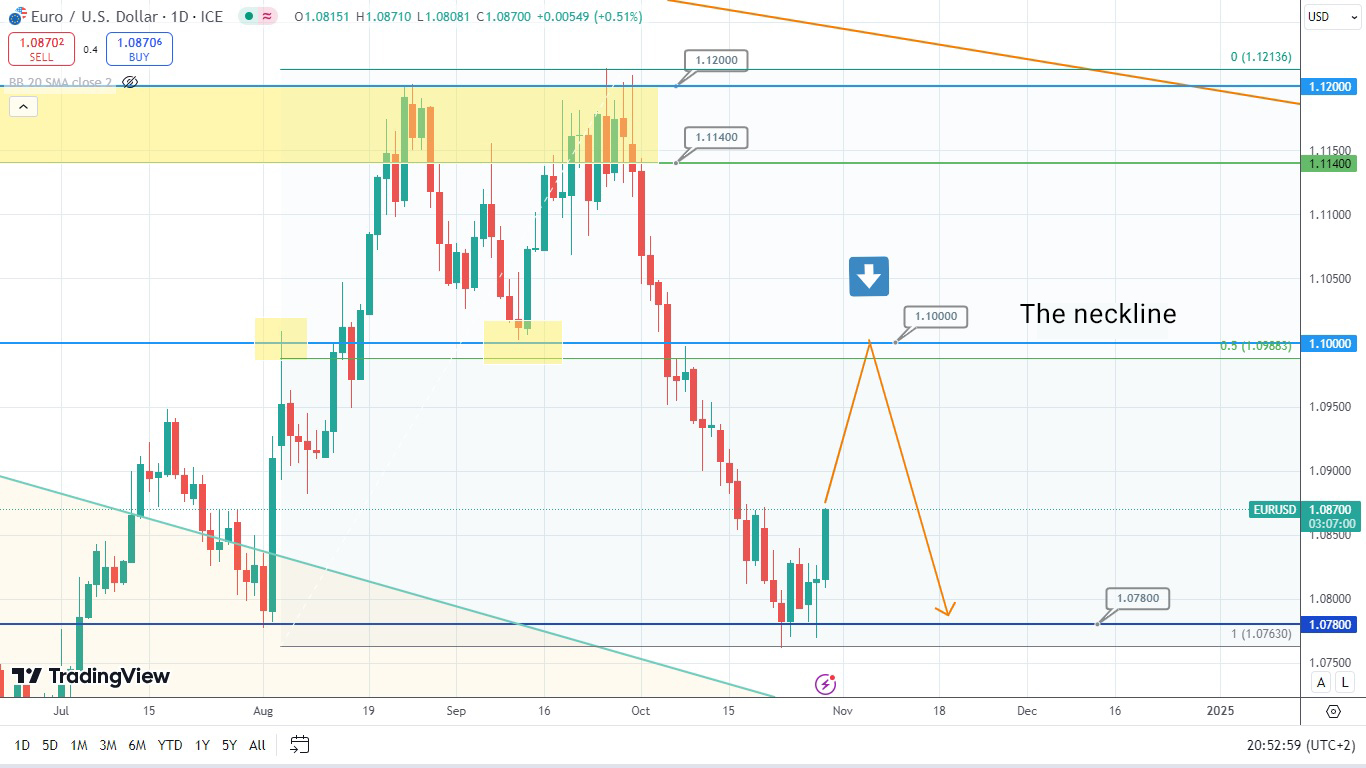
The price of the currency pair EUR/USD remained still for some time and then rebounded from the supporting level of 1.0780. It is undergoing correction right now. The price of this asset might eventually rise and face resistance at the level of 1.1000, which also acts as a broken neckline of the double bottom and 50% Fibonacci retracement from the latest descending move. At that, the asset’s price is likely to pull back from this resistance and drop. So, let’s observe if this scenario will be realized.
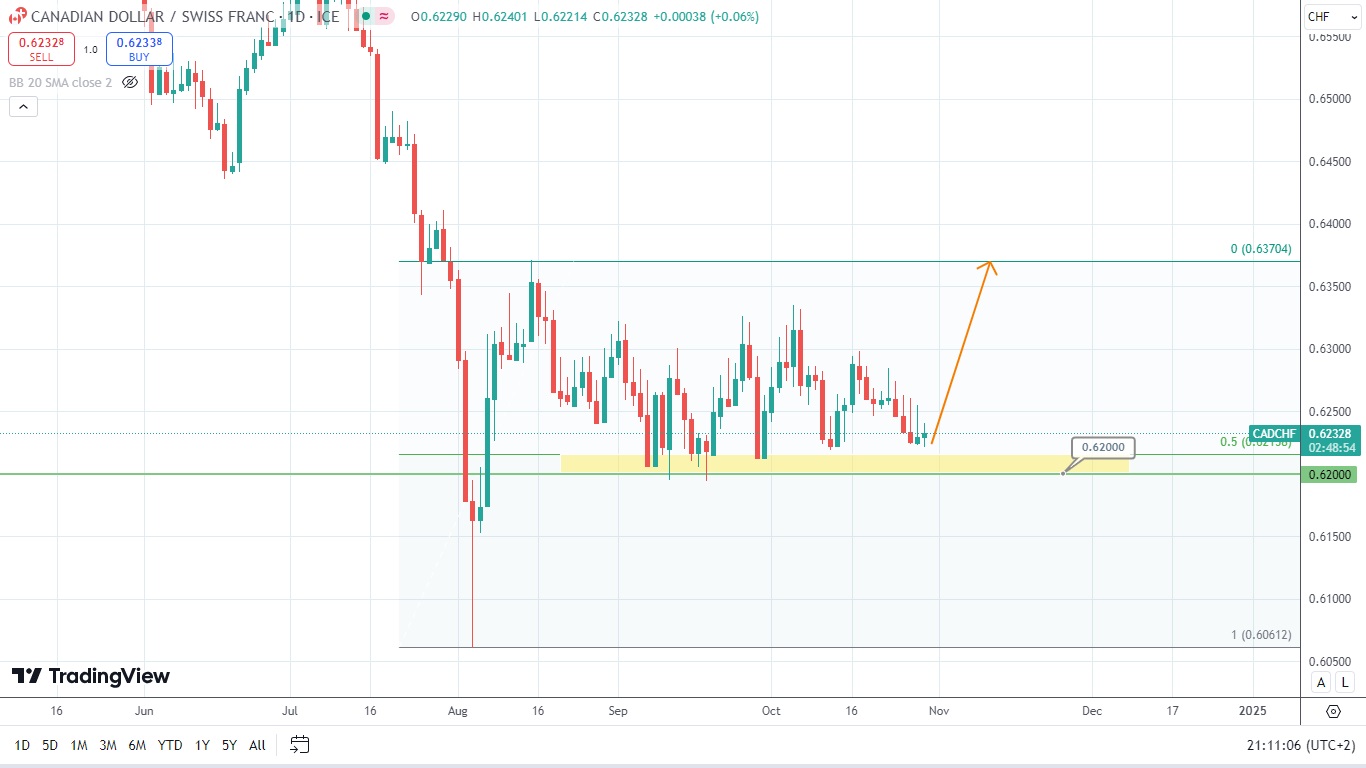
Also, let’s have a look at the current cross rate of the currency pair CAD/CHF. First, the price of this asset has formed the spike. After that, it has been testing the middle point of this spike for several months in a row. This point is also located next to the psychological horizontal level of 0.6200. The chart below shows potential for an upcoming price rise. Of course, if the price of this currency pair breaks the level of 0.6200 (0.6195), it might drop. So, let’s observe what the next price movement of this asset might be.
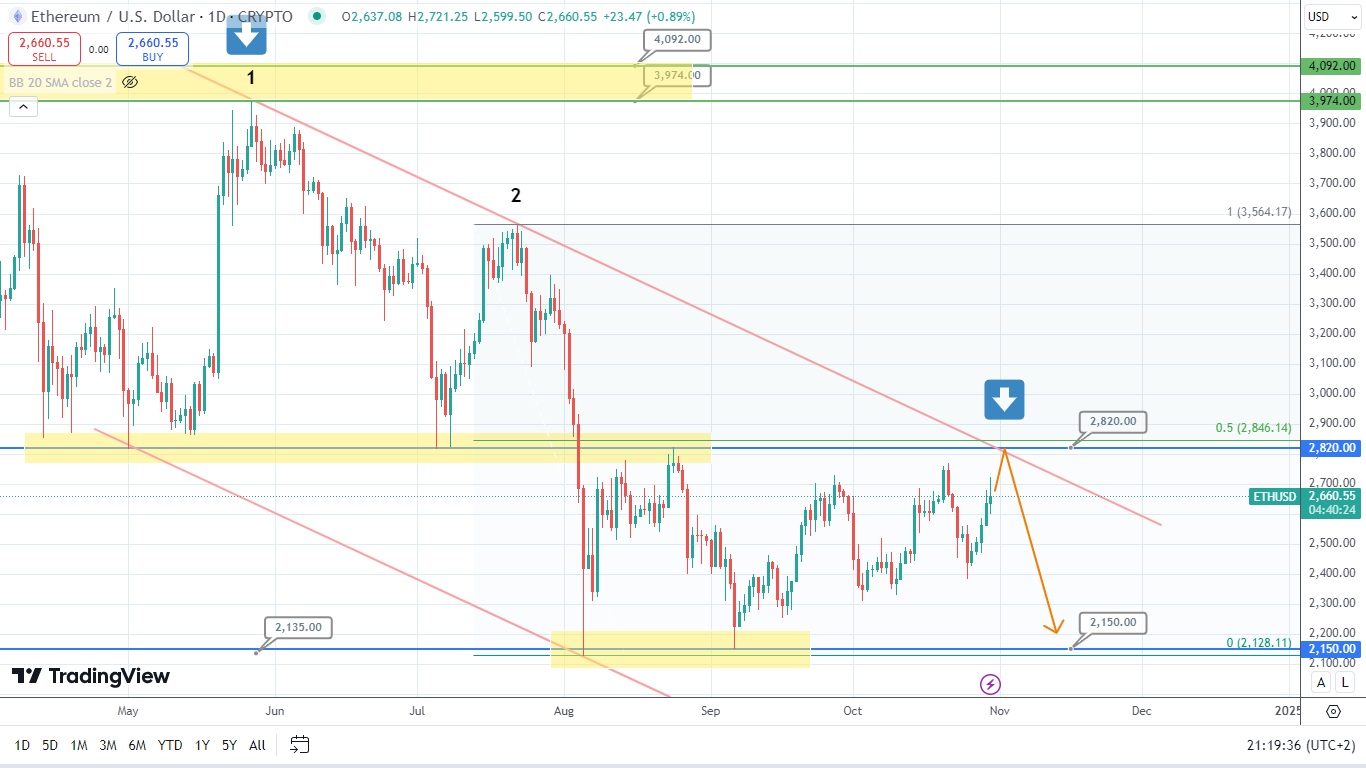
Now, the price of Ethereum is targeting the crossing point of the downtrend and resistance level of 2820, which also acts as 50% Fibonacci retracement level. The price of this cryptocurrency might potentially rebound from this point, become bearish, and drop. Time will tell how soon it is going to happen.
Disclaimer: The material provided is for information purposes only and should not be considered as investment advice. The views, information, or opinions expressed in the text belong solely to the author, and not to the author’s employer, organization, committee or other group or individual or company.
Past performance is not indicative of future results.
High Risk Warning: CFDs are complex instruments and come with a high risk of losing money rapidly due to leverage. 69% and 73% of retail investor accounts lose money when trading CFDs with Tickmill UK Ltd and Tickmill Europe Ltd respectively. You should consider whether you understand how CFDs work and whether you can afford to take the high risk of losing your money.
Futures and Options: Trading futures and options on margin carries a high degree of risk and may result in losses exceeding your initial investment. These products are not suitable for all investors. Ensure you fully understand the risks and take appropriate care to manage your risk.