EUR/USD Forecast: Bullish Market Sentiment Is Underway!

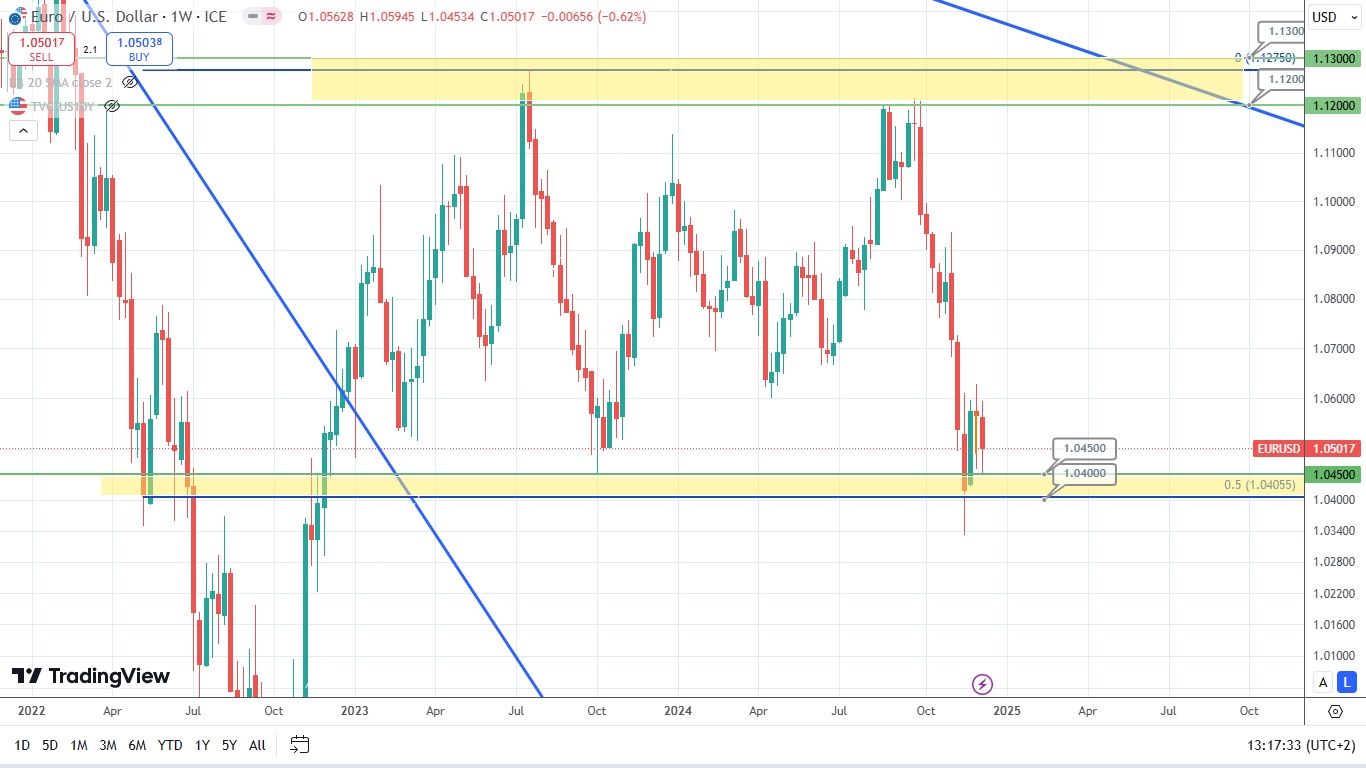
Last week bulls seized the initiative and kept the price of the currency pair EUR/USD in the supporting zone formed between levels 1.0400 and 1.0450. The price of this asset tried to exit this zone, but to no avail. It looks like the price of the currency pair might potentially reverse and head North. So, let’s wait and see what is going to happen next.
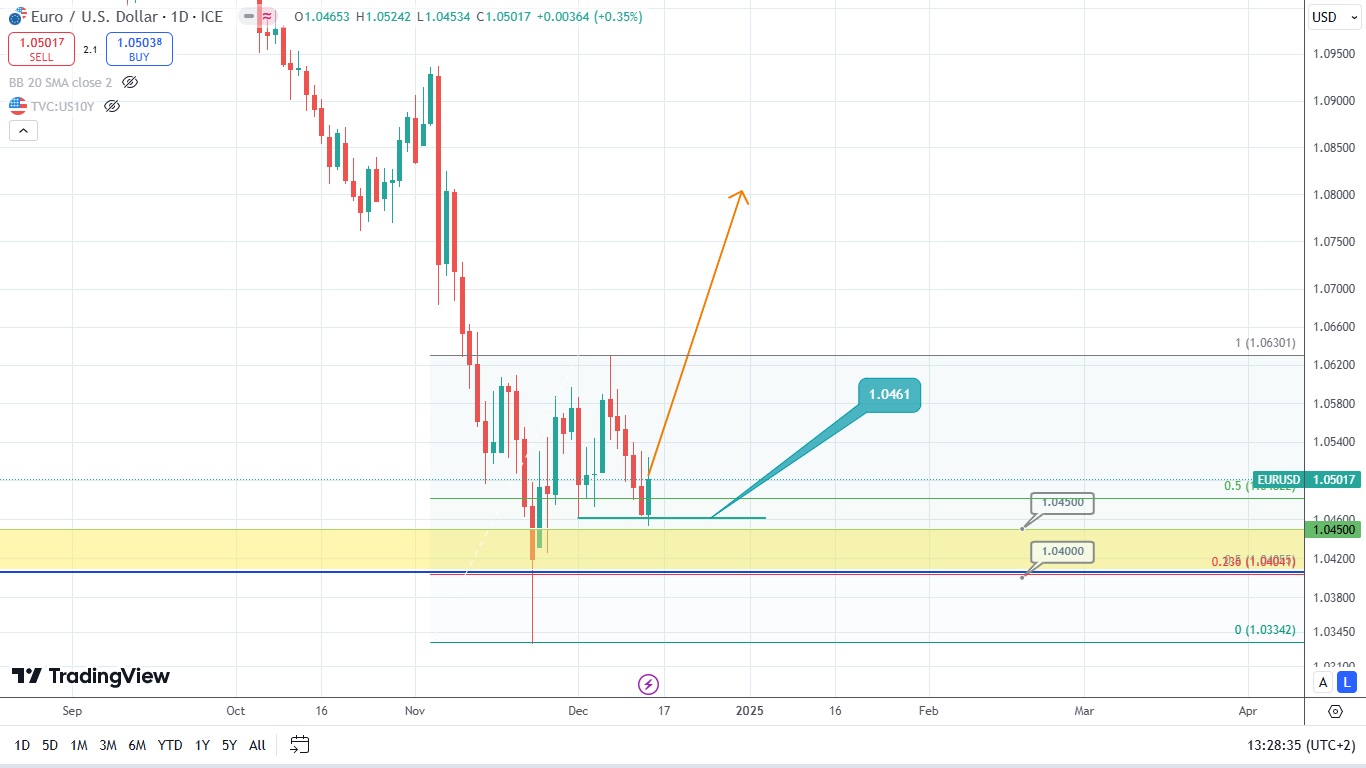
The daily chart shows the bullish engulfing that formed right at the end of the trading week. This engulfing is resting upon the local supporting level of 1.0461. At that, the asset’s price jumped above the 50% Fibonacci retracement level from the latest ascending move. It means that bulls are getting stronger, and the price of the currency pair might potentially undergo correction and rise even higher, leaving the last drop far behind.
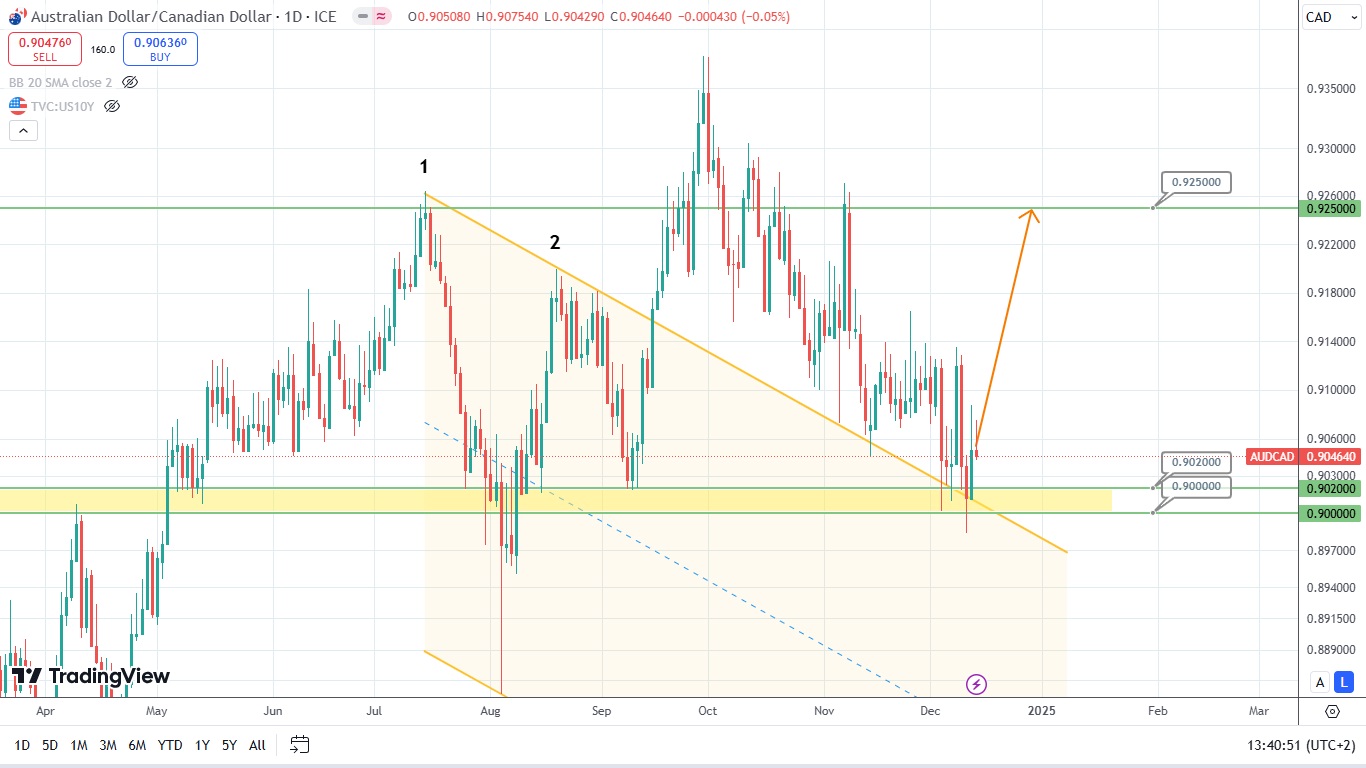
Now, let’s have a look at the cross rate of the currency pair AUD/CAD. Last week bears tried to seize the initiative and make the asset’s price dive below the psychological supporting level of 0.9000. However, bulls stepped in and did what they had to do. Also, the chart below reflects the close location of the broken downtrend next to a very important supporting zone. This downtrend has been tested many times in a row, but without any definite success. The bullish engulfing formed in the middle of the last trading week, thus signifying the upcoming Northern scenario and potential price rise to the level of 0.9250. This also means increasing interest of buyers and favorable market sentiment. So, let’s see whether this scenario is going to work out.
Disclaimer: The material provided is for information purposes only and should not be considered as investment advice. The views, information, or opinions expressed in the text belong solely to the author, and not to the author’s employer, organization, committee or other group or individual or company.
Past performance is not indicative of future results.
High Risk Warning: CFDs are complex instruments and come with a high risk of losing money rapidly due to leverage. 69% and 73% of retail investor accounts lose money when trading CFDs with Tickmill UK Ltd and Tickmill Europe Ltd respectively. You should consider whether you understand how CFDs work and whether you can afford to take the high risk of losing your money.
Futures and Options: Trading futures and options on margin carries a high degree of risk and may result in losses exceeding your initial investment. These products are not suitable for all investors. Ensure you fully understand the risks and take appropriate care to manage your risk.