Brent Oil Analysis: Potential Price Rise Ahead
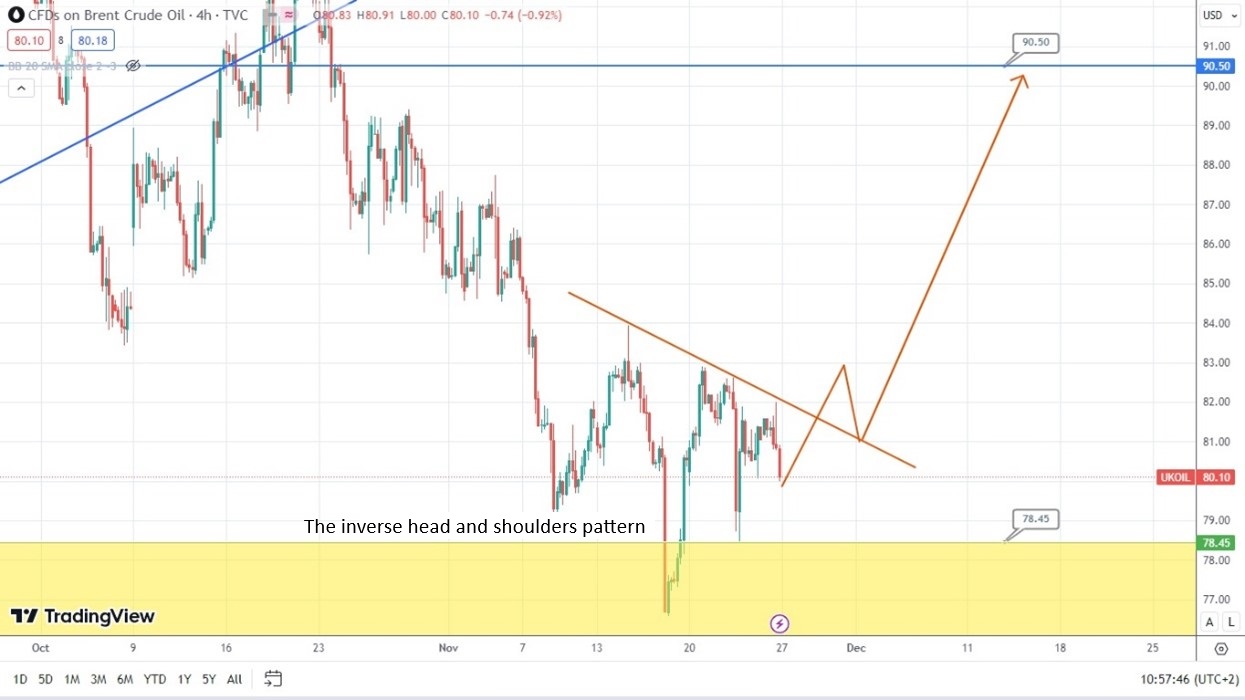
As can be seen from the 4-hour time frame, Brent oil is forming the inverse head and shoulders pattern and might have to face resistance at the level of 90 anytime soon. Should the price of this asset break the neckline of this pattern, it might potentially rebound to the broken trendline and rise again. So, let’s observe what might happen next.
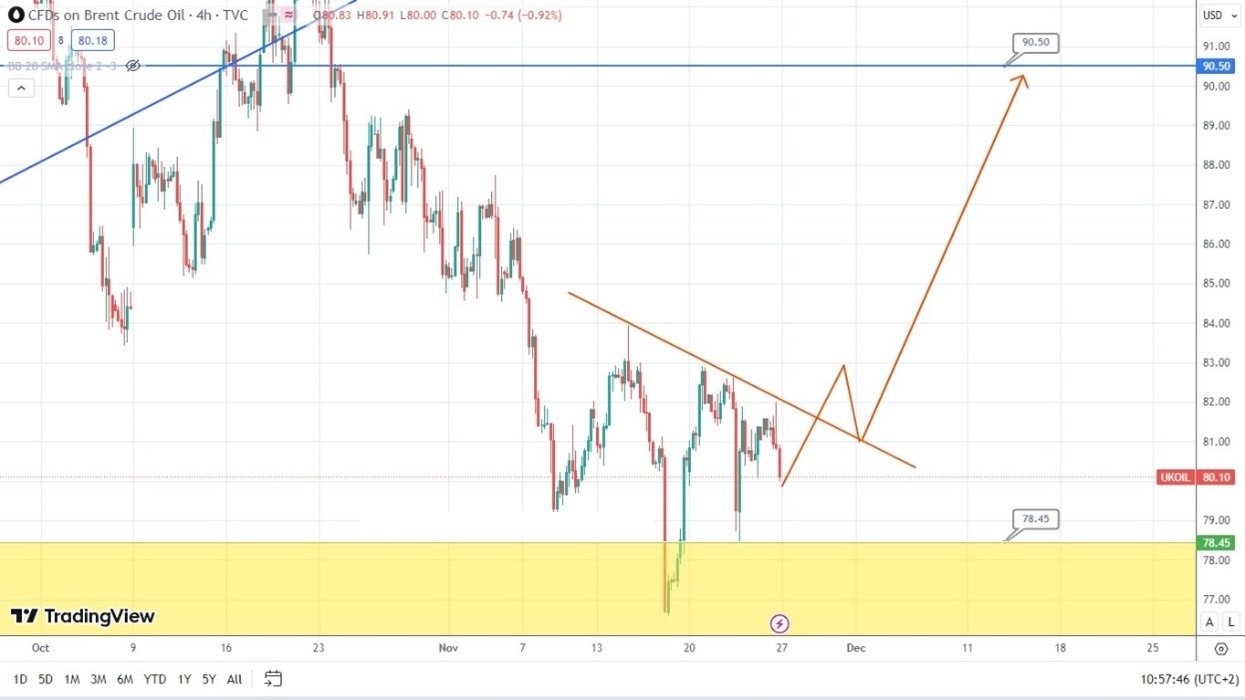
Currently, gold is testing the resistance area formed between levels 2000 and 2019. The price of gold is likely to drop and gain the required support at the level of 1940.
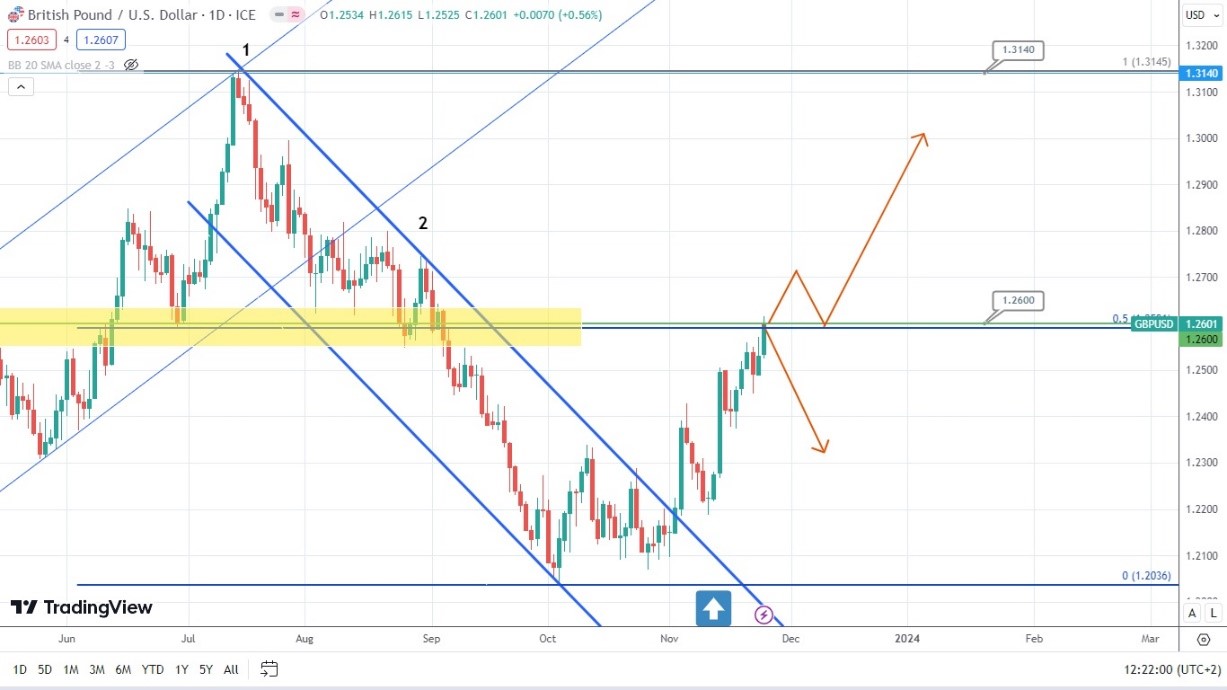
The British pound is testing the level of 1.2600 now. However, the price of this asset might either rebound and drop or break this level and rise. Hence, it would be very important to follow the price movements or candlestick formations around this level to understand whether the asset’s price is going to rise or drop.
Disclaimer: The material provided is for information purposes only and should not be considered as investment advice. The views, information, or opinions expressed in the text belong solely to the author, and not to the author’s employer, organization, committee or other group or individual or company.
Past performance is not indicative of future results.
High Risk Warning: CFDs are complex instruments and come with a high risk of losing money rapidly due to leverage. 71% and 74% of retail investor accounts lose money when trading CFDs with Tickmill UK Ltd and Tickmill Europe Ltd respectively. You should consider whether you understand how CFDs work and whether you can afford to take the high risk of losing your money.
Futures and Options: Trading futures and options on margin carries a high degree of risk and may result in losses exceeding your initial investment. These products are not suitable for all investors. Ensure you fully understand the risks and take appropriate care to manage your risk.