Chart of the Week, Bearish USDCHF
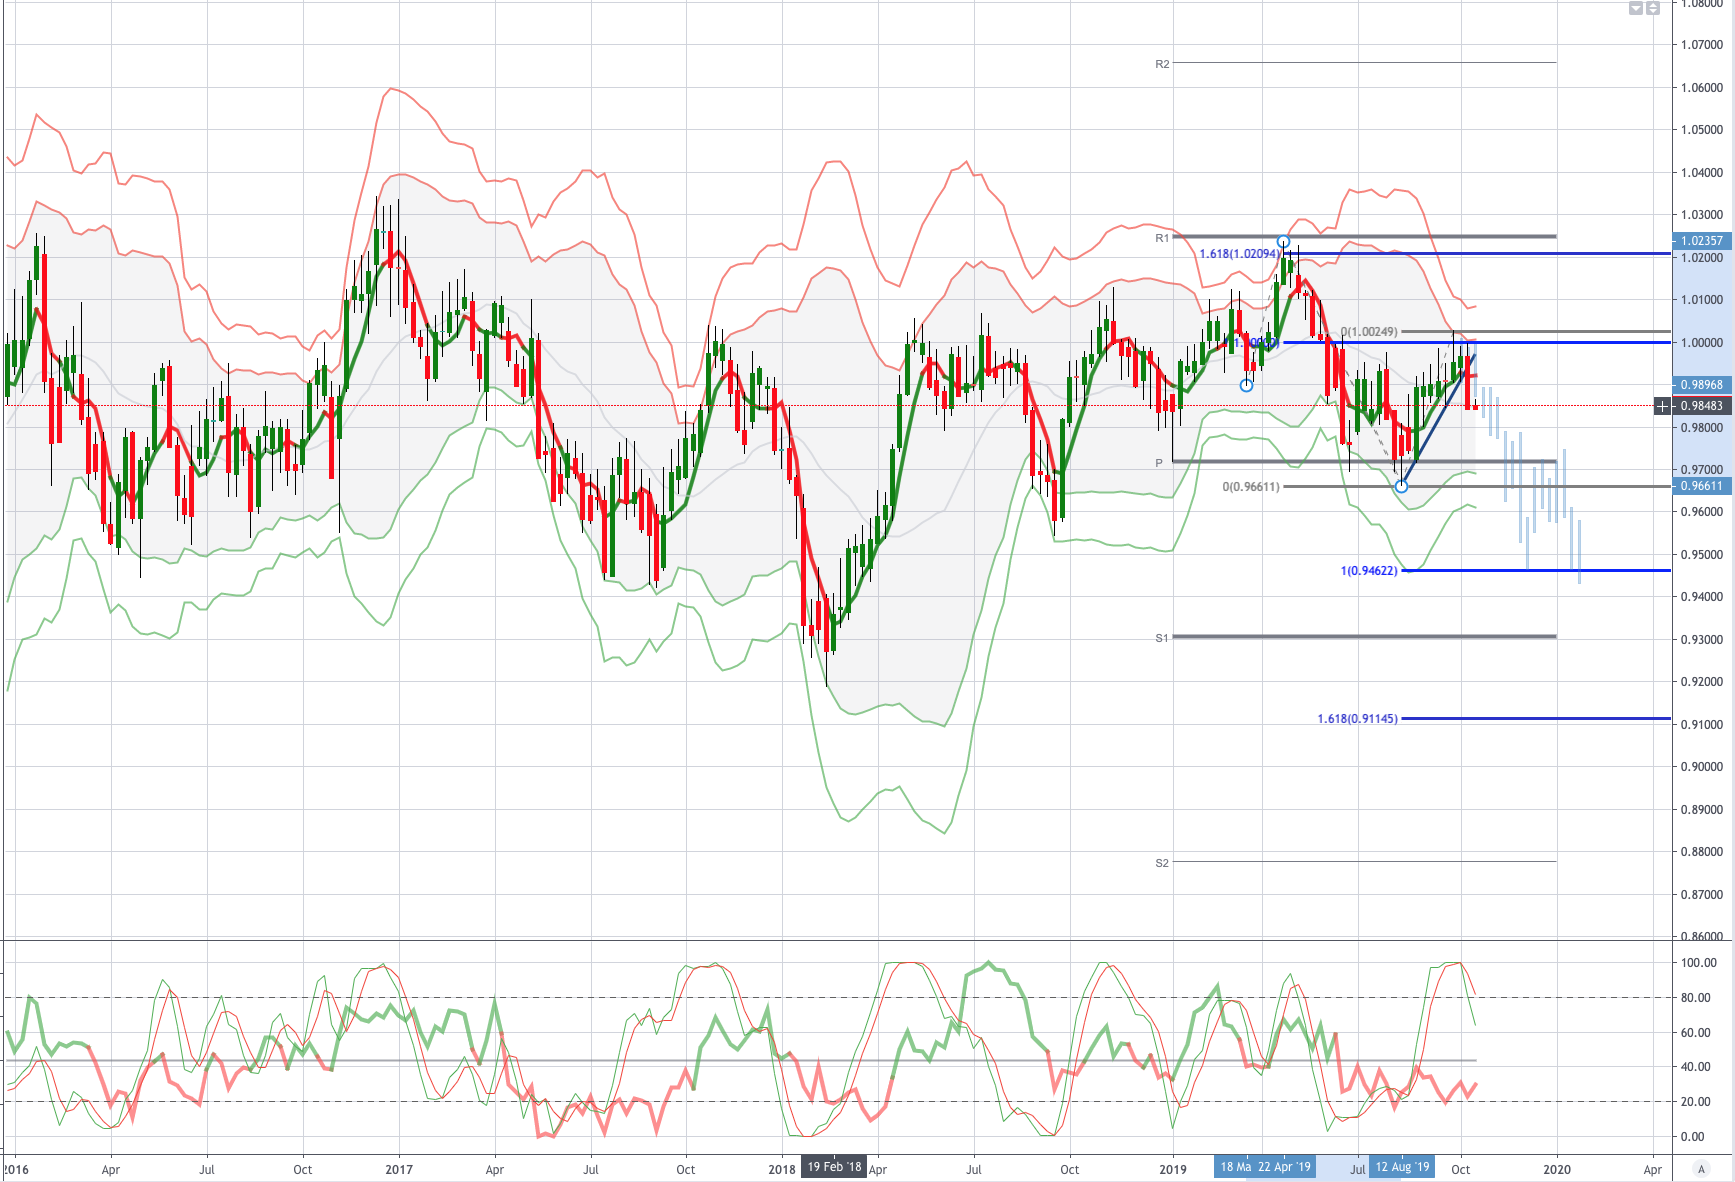
Chart of the Week Bearish USDCHF
Chart if the Week, USD: US leading index declined for a second month: index The Conference Board Leading Economic Index (LEI) for the U.S. declined 0.1% MOM in September (Aug: -0.2% revised) to 111.9 due to weaknesses in the manufacturing sector and the interest spread that were only partially offset by higher stock prices and positive contribution from the Leading Credit index. The Conference Board said that the latest LEI “reflects uncertainty in the outlook and falling business expectations, brought on by the downturn in the industrial sector and trade disputes”. It added that, looking ahead, the LEI is “consistent with an economy that is still growing, albeit more slowly, through the end of the year and into 2020”. Market has almost fully priced in the third consecutive rate cut for the upcoming 29-30 October FOMC after Fed’s Clarida opined that the Fed would take appropriate action to support the US economic expansion. Kaplan, on the other hand, said he was “more agnostic” whether to take more time to decide as there is also the December FOMC meeting.
CHF: The SNB remains uncomfortable with Franc appreciation and continues to remind the market it will need to be careful about any attempts at trying to force an appreciation in the currency. But the SNB will also need to be careful right now, as its strategy to weaken the Franc is facing headwinds from a less certain global outlook. Any signs of sustained risk liquidation, will likely invite a very large wave of demand for the Franc that will put the SNB in the more challenging position of needing to back up its talk with action, that ultimately may not prove to be as effective as it once was, given where we're at in the monetary policy cycle.
From a technical and trading perspective the USDCHF has tested symmetry swing resistance at the parity level af has faced strong resistance, last week’s candle printed a bearish key reversal week last week and as such price looks poised to trade lower over the course of this week. A break of .9839 would give and equality downside target of .9462 (AB=CD, as highlighted in the chart) a topside breach of .9929 would negate this view and give cause to reassess.
Disclaimer: The material provided is for information purposes only and should not be considered as investment advice. The views, information, or opinions expressed in the text belong solely to the author, and not to the author’s employer, organization, committee or other group or individual or company.
High Risk Warning: CFDs are complex instruments and come with a high risk of losing money rapidly due to leverage. 72% and 71% of retail investor accounts lose money when trading CFDs with Tickmill UK Ltd and Tickmill Europe Ltd respectively. You should consider whether you understand how CFDs work and whether you can afford to take the high risk of losing your money.
Disclaimer: The material provided is for information purposes only and should not be considered as investment advice. The views, information, or opinions expressed in the text belong solely to the author, and not to the author’s employer, organization, committee or other group or individual or company.
Past performance is not indicative of future results.
High Risk Warning: CFDs are complex instruments and come with a high risk of losing money rapidly due to leverage. 69% and 73% of retail investor accounts lose money when trading CFDs with Tickmill UK Ltd and Tickmill Europe Ltd respectively. You should consider whether you understand how CFDs work and whether you can afford to take the high risk of losing your money.
Futures and Options: Trading futures and options on margin carries a high degree of risk and may result in losses exceeding your initial investment. These products are not suitable for all investors. Ensure you fully understand the risks and take appropriate care to manage your risk.
Patrick has been involved in the financial markets for well over a decade as a self-educated professional trader and money manager. Flitting between the roles of market commentator, analyst and mentor, Patrick has improved the technical skills and psychological stance of literally hundreds of traders – coaching them to become savvy market operators!